Season so far: Serie A, 22 Nov 2015
I thought that it was about time to take another look at Serie A with my scatter graphics, having previously visualised it at the seven match mark in early October These are explained here if you haven’t seen them before and here are last season’s for reference.
Shot dominance
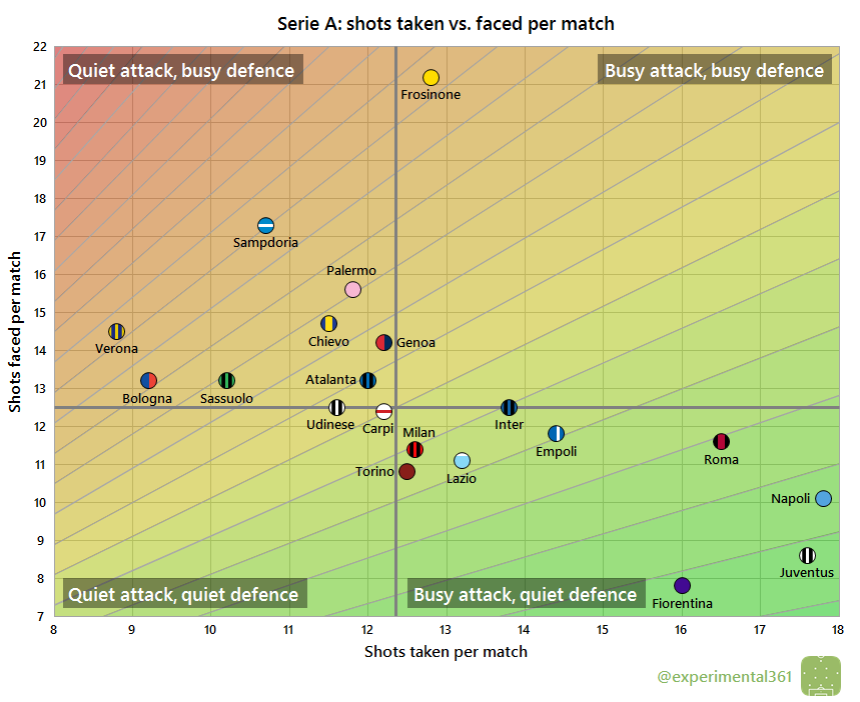
First of all, here is how the number of shots taken by each club compares with those they face in return. The average number of shots taken per match is on the horizontal and the average number faced is on the vertical, so bottom right (take plenty, allow few in return) is good while top left (take few, allow plenty) is bad:
While Inter are top of the table, they haven’t significantly out-shot their opponents overall this season. Nor have fifth-placed Sassuolo, who have racked up the third lowest shot tally so far.
The rest of the current top six – Napoli, Fiorentina, Roma and Juventus – stand apart from the rest with the four highest totals of shots taken and, with the exception of Roma, the fewest total shots faced.
Frosinone have struggled far more than the rest of the division at keeping opponents quiet: they’ve allowed an average of more than 21 shots per match, which is incredibly high.
Attacking effectiveness
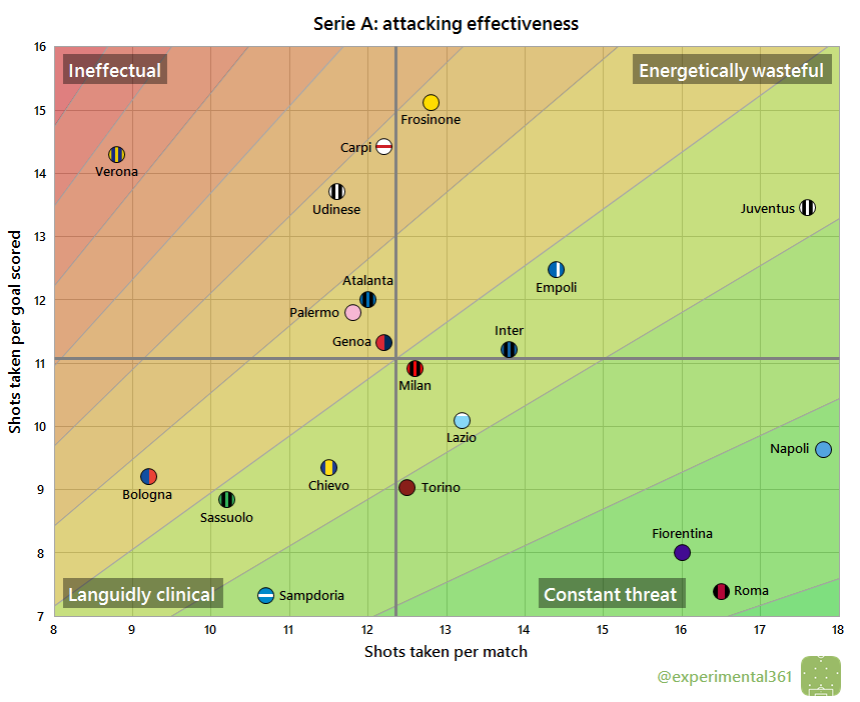
Now let’s look at attacking alone. The horizontal axis stays the same as in the graphic above, but now the vertical shows the average number of shots needed to score each league goal. Therefore bottom right is good (taking lots of shots and needing fewer efforts to convert) and top left is bad:
While Napoli, Roma and Fiorentina have all made good use of their large shot totals – converting them into goals more frequently than the average – Juventus have struggled to find the net. The four sides to have been more wasteful so far all currently reside in the bottom five.
The most clinical side so far has been Sampdoria, who have narrowly out-converted Roma and been twice as efficient in front of goal as Frosinone, the most wasteful side.
Poor Verona have really struggled up front: not only have they taken the fewest shots but they are also among the least effective finishers so far.
Defensive effectiveness
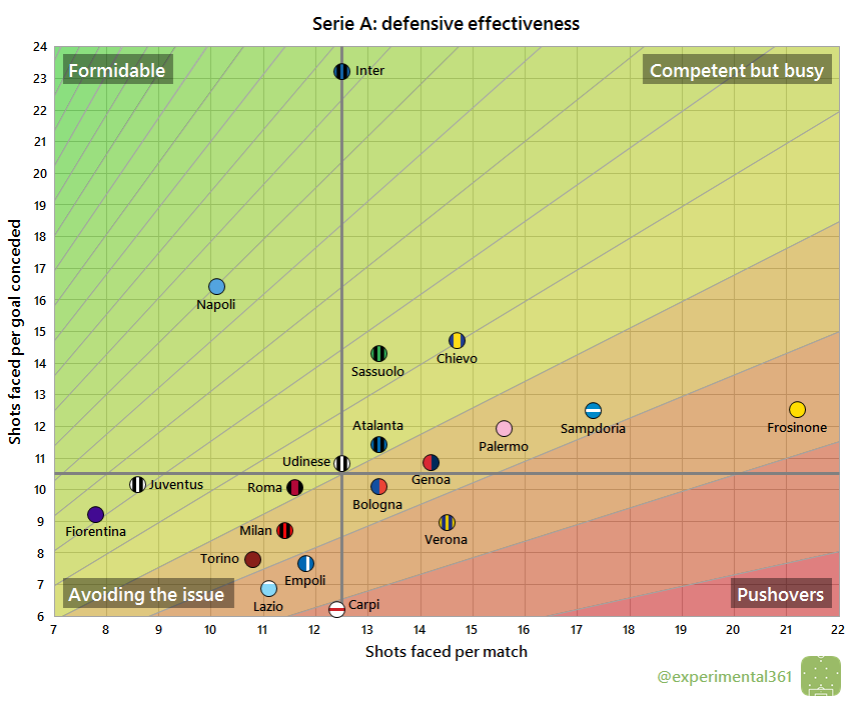
Finally let’s look at the defensive situation – basically take the above chart and replace the word “taken” for “faced” on both axes. Now top left is good – facing fewer shots and able to soak up more per goal conceded – and bottom right is bad:
It’s Inter‘s defence which has earned them top spot – if you check back to the last graphic you can see that their attack doesn’t look particularly special. Soaking up an immense average of over 23 shots for each goal conceded is unlikely to persist over a whole season however.
The next best performing defence is that of Napoli, who have allowed the third fewest shots against them and absorbed a still-impressive number for each goal conceded.
Despite allowing opponents a relatively average number of shots, Carpi have struggled to keep many out: it takes an average of just over six attempts to score against them, compared to the average of over ten.


You must be logged in to post a comment.