
Bundesliga attack & defence update
The lull created by the international break is as good an opportunity as any to crank out some updated attack and defence scatter graphics for the major European leagues, starting here with the Bundesliga.
There are two graphics: the first showing attacking performance and the second defensive performance. Both are based on simple shot data and give a high-level view of how each club is doing relative to the others, with the axes centred on the divisional average. You can click on a graphic to bring up a full-sized version in a new tab.
Attacking
Looking first at attacking, the average number of shots taken per match is on the horizontal axis and the average number of shots needed to score each goal is on the vertical. Therefore bottom right is good (taking lots of shots and needing fewer efforts to convert) and top left is bad:

- Perhaps unsurprisingly Bayern are out-shooting the rest and firing in almost twice as many efforts as the least productive attackers Hertha.
- Things haven’t gone well up front for Hamburg, who need almost twice as many attempts to find the net as the average Bundesliga side. Paderborn and Dortmund have also struggled to convert chances this season, but the latter at least have created plenty of chances.
Defending
Now let’s look at the defensive situation – basically take the above chart and replace the word “taken” for “faced” on both axes. Now top left is good – facing fewer shots and able to soak up more per goal conceded – and bottom right is bad:
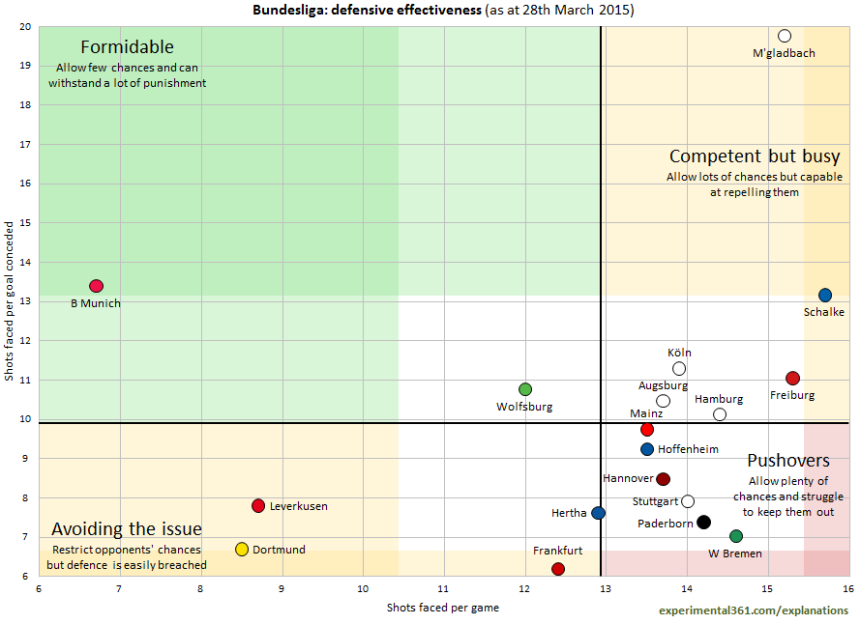
- Bayern seem to love ruining my graphs. Here they allow so few shots per match – fewer than half the Bundesliga average – that most of the division’s clubs are squashed together in the bottom right.
- The squashing is only exacerbated by Borussia Mönchengladbach‘s incredibly resilient defence which, while allowing the third most shots in the division, is virtually twice as difficult to break down than the average side.

Pingback: #Link11: Von Menschen und Göttern | Fokus Fussball