E Ratings update: League 2, 23 Oct 2016
Here is the latest update of the season to the E Ratings and how they predict the rest of the season will pan out. The rating system is explained here, but in a nutshell it’s based on the combined quality of chances that clubs create and allow, rather than their results.
The attack rating broadly equates to how many goals’ worth of chances a team would create against an average opponent (so higher is better), with the defence rating equivalent to the chances they’d be expected to allow (so lower is better). The overall rating is the difference between the two – effectively the average expected goal difference per match – so a positive number is good and a negative one is bad.
The graphic below lists each club in descending order of their overall E Rating and shows how this – along with their individual attack and defence ratings – has changed over the past 30 league matches. The red and green arrows indicate how the overall rankings have moved in the past month and the numbers in brackets show the ranks for each team’s attack and defence ratings.
Another unlucky-looking defeat saw Portsmouth‘s ratings rise further. The ratings do take consistent underachievement into account but the margin of chances created in their loss to Notts County was substantial.
A strong performance from Luton continued their rise in the rankings despite Mansfield holding them to a draw, with the Hatters overtaking Doncaster who look to have stalled in recent weeks.
Cambridge‘s narrow win at Exeter saw them rise two places. One of the sides they overtook were declining Leyton Orient, whose win at Hartlepool looked a bit fortunate. Hence Orient sank despite winning the match while their hosts rose one place.
You can see how each match played out here.
Predicting the rest of the season
Below I’ve used each club’s current ratings and those of their remaining opponents to predict how the rest of the season could play out. Each of the remaining fixtures has been simulated thousands of times, using the current E Ratings to generate probabilities for where each club will finish.
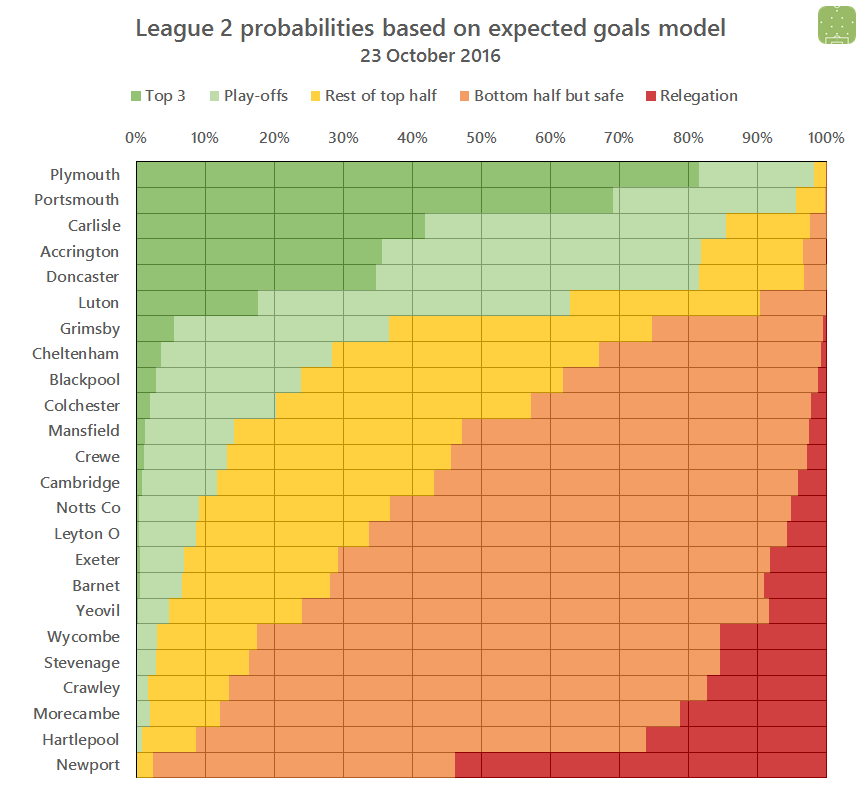
This graphic shows the cumulative probability of where each club could end up, in descending order of average points won. You can think of the ordering of the teams down the left hand side as a “best guess” of the final league table, with the coloured bars showing the relative likelihood of each club ending up in a certain section of the table:
A frustrating defeat for Portsmouth means that their superior rating is no longer sufficient to keep their prospects aligned with those of Plymouth, who currently have a better than 80% chance of a top three finish.
Six of the top seven places have likely occupants, with Luton‘s strong showing boosting their probability of finishing north of 8th above 60%. Cheltenham and Grimsby may have only just rejoined the EFL but both look among the more capable of finishing the season in the play-off zone.
Newport currently have a marginally greater than 50% chance of relegation but there’s no clear favourite for the second relegation spot. Hartlepool are the next most likely to drop as it stands, but they put in an encouraging performance despite their home defeat to Orient so the order at the bottom could well change.


You must be logged in to post a comment.