
Attacking & Defensive Effectiveness – top European divisions
Seeing as the attack and defence charts for the Football League have proven so popular, I thought I’d throw together a version comparing as many top flight divisions as possible. Unfortunately I could only find sufficiently granular free data for England, Spain, Germany, Italy and France, but this is still plenty to be getting on with. Clubs are colour coded by country as I’m sure you’ll work out.
There are two graphs: the first compares how many shots each team averages per match vs. how many shots it takes them to score each goal, and the second flips this around to compare shots faced and goals conceded. The axes are centred on the overall average, splitting the distribution into labelled quadrants and the shading shows areas outside 1 standard deviation from the average. This might be explained better via the ‘Explanations’ tab above.
Click each picture to bring up a full-sized version in a separate tab.
Attacking
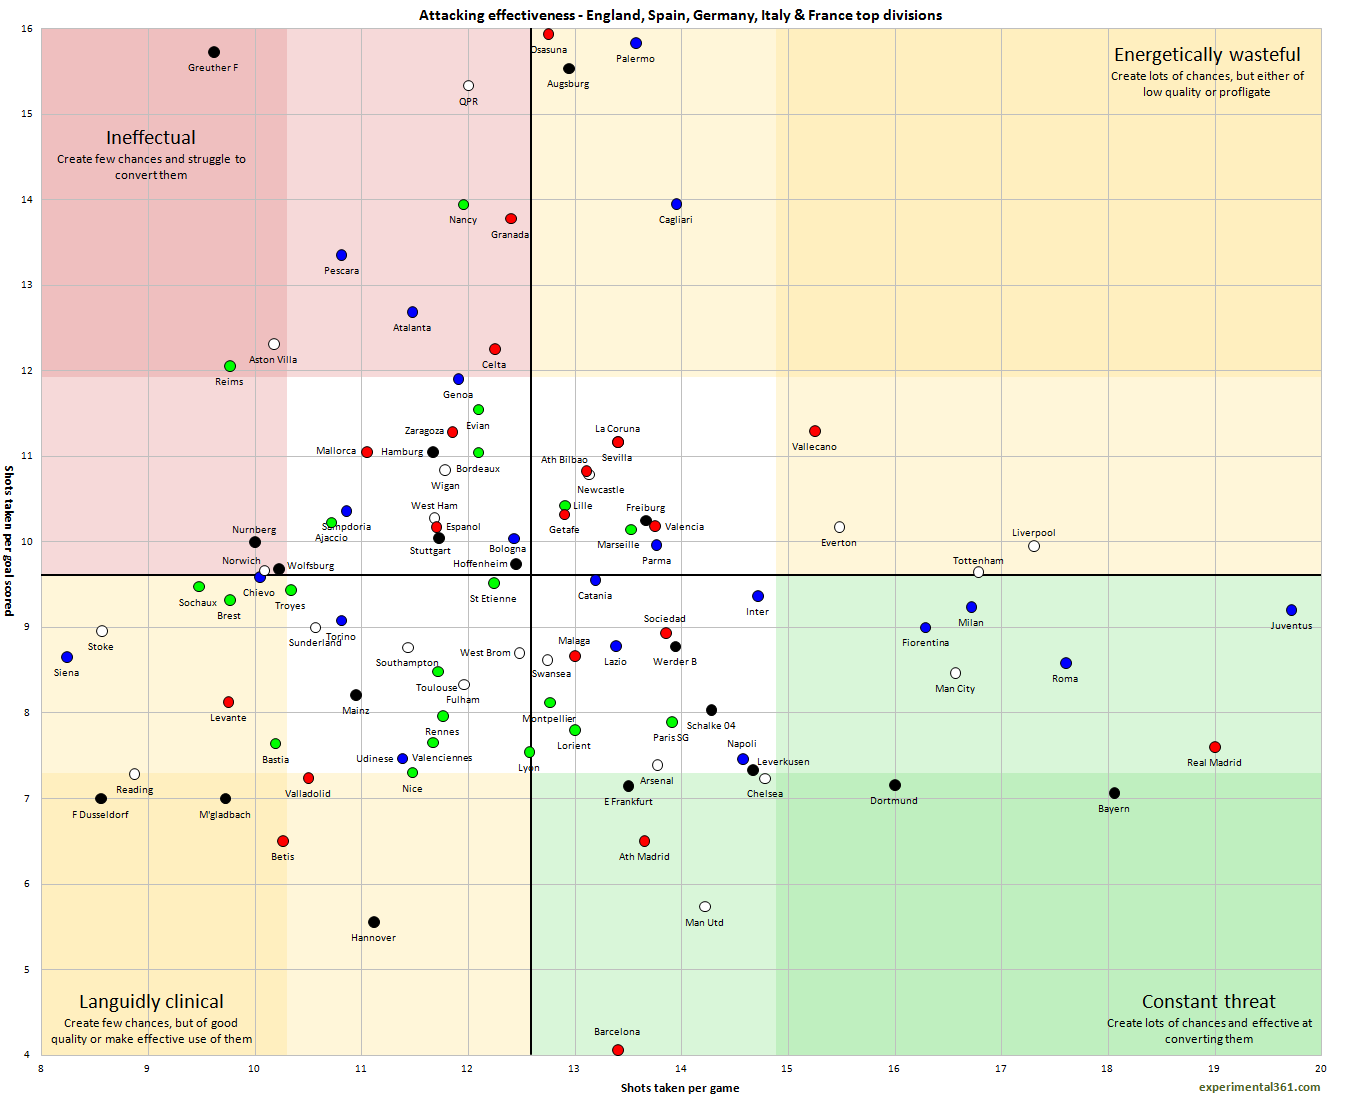
A few quick observations to give you the idea if you’ve not seen these before:
- Juventus take the most shots per match – while Real Madrid aren’t far behind, both they and Bayern are more efficient at converting chances.
- What’s interesting is that Hannover just edge Man Utd as the second most clinical side here, although the Premier League leaders fashion an average of 3 additional chances per match to give them a greater overall goal threat.
- Barcelona are the most clinical team in front of goal, requiring an average of just over 4 shots to score each goal while La Liga stablemates Osasuna are the most wasteful, needing almost 4 times as many.
- At least Osasuna are having a respectable amount of shots on goal, which is more than can be said for Greuther Fürth. Aston Villa and Reims join them in being an unwanted outlier for both chance creation and conversion
Defending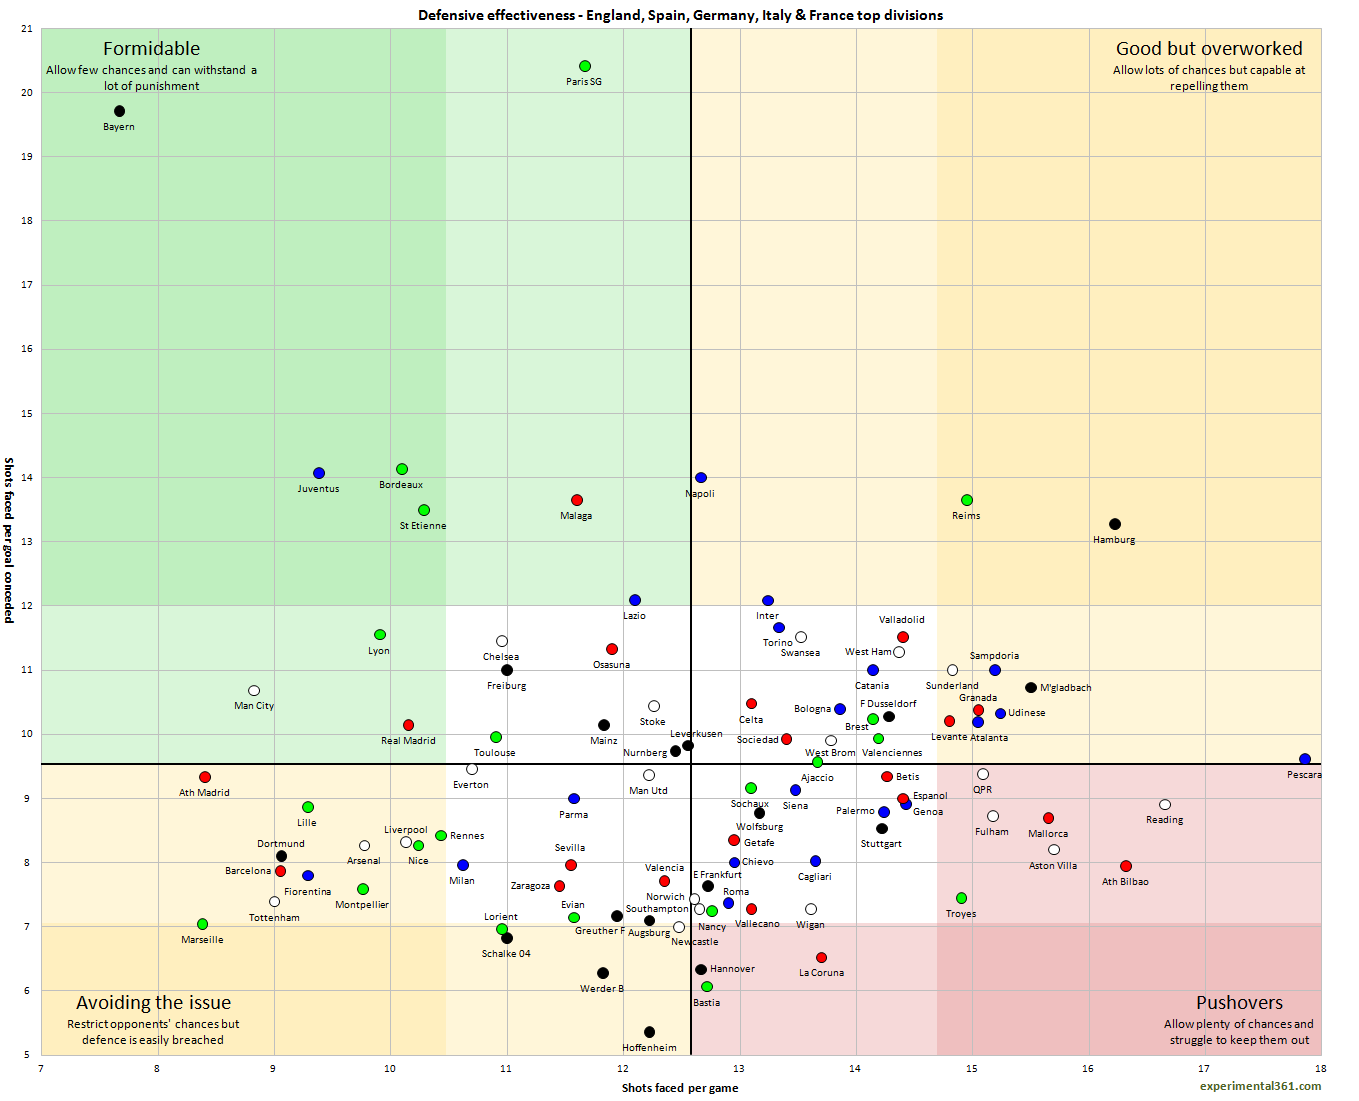
Again a few quick example observations:
- Bayern and PSG are significantly tougher to break down than any other side here, with both able to soak up an average of around 20 shots before conceding. The former are also the best here at restricting their opponents’ chances, although Atlético Madrid and Marseille aren’t far behind.
- Nobody has to face more shots than Pescara, who have to endure almost 18 per match while the easiest defence to breach is that of Hoffenheim, which requires just over 5 shots.
When you compare it to the same charts for the Football League, the one thing that stands out is how much better the leading teams are doing. While the lowest points of the distribution are in a similar position, the upper reaches are way out in front, suggesting to me that the funds available to the most successful teams allow them to attain significantly higher levels of performance. There were outliers like Bayern in the early stages of the Football League season, but none of them were able to sustain this over half a season.
Hopefully these are useful – if anyone knows where I can get shots taken and faced data for other leagues then please let me know – I’d love to cram even more teams onto these.

Brilliant work. Even by their standards, Barcelona’s efficiency this season is incredible. They’re running at just over twice the average. Not taking many shots outside the box helps. Messi too obviously.
Simple, but yet so excellent work!
Bayern’s defence is ridiciously good.
Has the italian football changed so much? I expected the good italian teams to be in the left down corner, so being very effective but having few chances, but the usual suspects (like Milan, Roma, Inter, Juve) are rather far right sided…?
I ment the attacking graphic
The stereotype of Italian football no longer holds the test of reality. Top teams in the peninsula have long been playing attacking brand of football. Juve has not been much different from Bayern or even Barca in that matter. Roma in particular have adopted extremely attacking style under Zeman.
Even the national team has been playing the same way.
Catenaccio is in the past. It is only applied when low-ranked teams face top opponents. The game is changing in Italy… hopefully for good 🙂
I only started to really watch Italian football last season and i have to agree. Like in all leagues there are boring games but overall, they play attractive attacking football.
Great work, interesting info.
How about a champion’s league only graph? Because comparing teams playing in different leagues makes no sense at all. Bayern Munich playing in the bundesliga will obviously score more against lesser opposition, as opposed to Manchester united, who plays in a much more competitive league where scoring is more complicated.
I wouldn’t go as far as to say that comparing different leagues makes no sense although it’s true that the competitive balance is different between leagues, with the horribly unfair distribution of TV money in Spain springing to mind. I’m happy that the colour coding allows differences between leagues to be seen – what I might do if I have time is to look at some data for previous seasons as then you could make a judgement about which leagues are more competitive.
The problem in doing a Champions League graph is that there aren’t really enough matches to make one of these graphs statistically reliable, plus you still have the same issue of balance if one team has a particularly easy group.
Just to manage the expectations of anyone who’s read this far, the focus of this blog will always be the English Football League, so analyses of other competitions will remain intermittent and ad hoc!
Although I dont follow the premier league as much I dont think scoring is more complicated overthere or it is much more competitive than the Bundesliga. All Bundesliga Clubs are still in the Championsleague and what about all the high scoring games this season in the premier league?
Bayern scores more against the smaller teams because they are a better team than any English side. The average gap from first to last in the Premiership has been significantly larger than in the Bundesliga over the last decade.
I think even a Champions League comparison is hard. First of all there are a lot of teams in the first round that will never reach the half finals. That’s pretty much the same as in every league with top clubs vs. worst clubs.
And just comparing the play offs does not give you enough games against each other to have a fair comparison.
Pingback: Die Blog- & Presseschau für Mittwoch, den 23.1.2013 | Fokus Fussball
Pingback: TOTW: We all love Adam Le Fondre - Unofficial Network
Pingback: Attacking & Defensive effectiveness: EPL to BSP « Experimental 3-6-1
Pingback: experimental 3-6-1, meins. Fußballstatistiken der großartigen Art. | Stehplatzhelden - Aus Liebe zum Spiel // Fußball
Pingback: Statistik zum Freitag | NedsBlog