
Scatter graphics: Premier League, 6 Apr 2023

Ahead of the Easter break I thought it was worth creating one final in-season version of the scatter graphics before the end of the season. These compare the attacking and defensive performances of every team in a division – each of the four graphics is explained briefly below and at length here. Shot dominance First of all, here is how the
Read more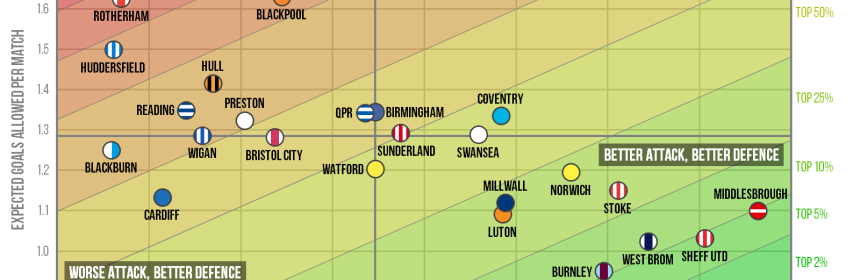


You must be logged in to post a comment.