Expected goals table: Championship, 2022-23
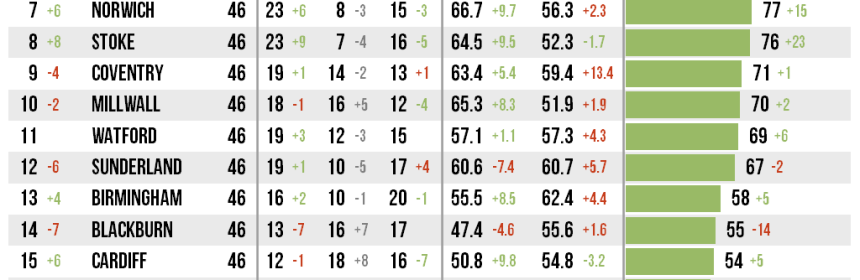
These alternative league tables are calculated using expected goals (as seen in my match timelines). There’s a full explanation in the first post here.
Read more
These alternative league tables are calculated using expected goals (as seen in my match timelines). There’s a full explanation in the first post here.
Read more
Here are the individual timeline graphics for the latest round of matches, comparing the quality of chances created by each team with goals scored. There’s a full explanation of these here for anyone who’s not seen them before.
Read more
Here are the individual timeline graphics for the latest round of matches, comparing the quality of chances created by each team with goals scored. There’s a full explanation of these here for anyone who’s not seen them before.
Read more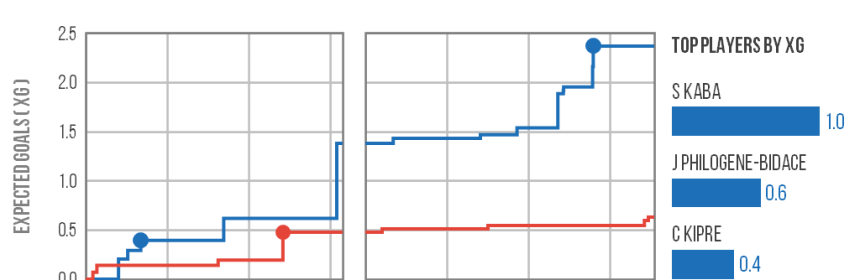
Here are the individual timeline graphics for the latest round of matches, comparing the quality of chances created by each team with goals scored. There’s a full explanation of these here for anyone who’s not seen them before.
Read more
Here are the individual timeline graphics for the latest round of matches, comparing the quality of chances created by each team with goals scored. There’s a full explanation of these here for anyone who’s not seen them before.
Read more
Here are the individual timeline graphics for the latest round of matches, comparing the quality of chances created by each team with goals scored. There’s a full explanation of these here for anyone who’s not seen them before.
Read more
Here are the individual timeline graphics for the latest round of matches, comparing the quality of chances created by each team with goals scored. There’s a full explanation of these here for anyone who’s not seen them before.
Read more
Here are the individual timeline graphics for the latest round of matches, comparing the quality of chances created by each team with goals scored. There’s a full explanation of these here for anyone who’s not seen them before.
Read more
Here are the individual timeline graphics for the latest round of matches, comparing the quality of chances created by each team with goals scored. There’s a full explanation of these here for anyone who’s not seen them before.
Read more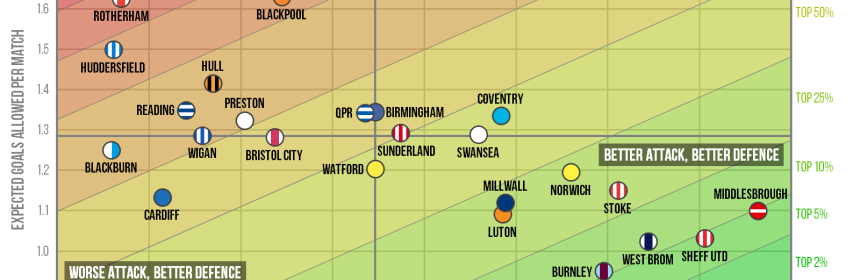
Ahead of the Easter break I thought it was worth creating one final in-season version of the scatter graphics before the end of the season. These compare the attacking and defensive performances of every team in a division – each of the four graphics is explained briefly below and at length here. Shot dominance First of all, here is how the
Read more
You must be logged in to post a comment.