Scatter graphics: Bundesliga, 5 Oct 2016
With the international break upon us I’ve chucked the data from some of the major European leagues into my scatter graphics to see how they’re shaping up so far. It’s still early days but usually some interesting patterns are already beginning to emerge. Each of the three graphics is explained briefly below but there’s a longer explanation here.
Shot dominance
First of all, here is how the number of shots taken by each club compares with those they face in return. The average number of shots taken per match is on the horizontal and the average number faced is on the vertical, so bottom right (take plenty, allow few in return) is good while top left (take few, allow plenty) is bad. The stripes are like contours: the greener the stripe, the better the performance (and vice versa for red).
As is often the case, Bayern sit proudly in the dominant bottom right corner. They’ve taken over 19 shots per match so far and allowed fewer than seven in return, both of which are the best in the division.
Darmstadt are the opposite, ranking worst in both categories, albeit with a slightly less extreme difference than the league leaders and with other clubs at least close to them on both axes: Hertha in attack and Köln in defence.
It looks like there’s been plenty of entertainment for the neutral when Hoffenheim have been involved: they rank second for shots taken but have also faced the third most, adding up to around 33 per game combined.
Attacking effectiveness
Now let’s look at attacking alone. The horizontal axis stays the same as in the graphic above, but now the vertical shows the average number of shots needed to score each league goal. Therefore bottom right is good (taking lots of shots and needing fewer efforts to convert) and top left is bad:
Three clubs are stretching this graphic out with some wasteful finishing so far: Hamburg, Ingolstadt and Wolfsburg have all taken far in excess of 20 shots for each goal scored.
While Bayern and Dortmund are unsurprisingly the most dangerous attackers overall, there are three clubs in the bottom left who have converted chances more efficiently. Hertha are the most clinical finishers so far, although they also take the second fewest shots, with Mainz and Mönchengladbach also turning their relatively few chances into goals at an impressive rate.
Defensive effectiveness
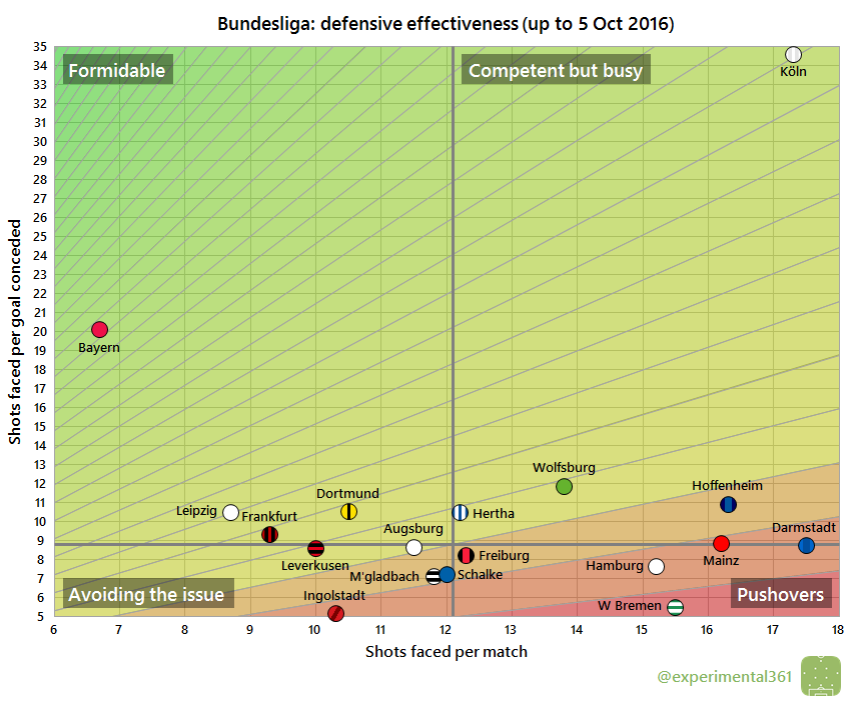
Next let’s look at the defensive situation – basically take the above chart and replace the word “taken” for “faced” on both axes. Now top left is good – facing fewer shots and able to soak up more per goal conceded – and bottom right is bad:
Köln‘s goal has led a charmed life so far, having seen more shots directed towards it than anyone except Darmstadt, but only conceding once for every 34-35 attempts so far. This is dwarfing the still-impressive average of 20 shots that Bayern soak up for each goal conceded.
The most porous defence has been that of Ingolstadt, although they at least don’t allow all that many chances. Poor Werder Bremen have been almost as leaky while having far more efforts to deal with.


You must be logged in to post a comment.