
2017 league table
Last year I threw together a 2016 calendar year table for the 92 Premier League and EFL clubs which people seemed to like, so now that the final league game of 2017 has been played I thought I’d create one again.
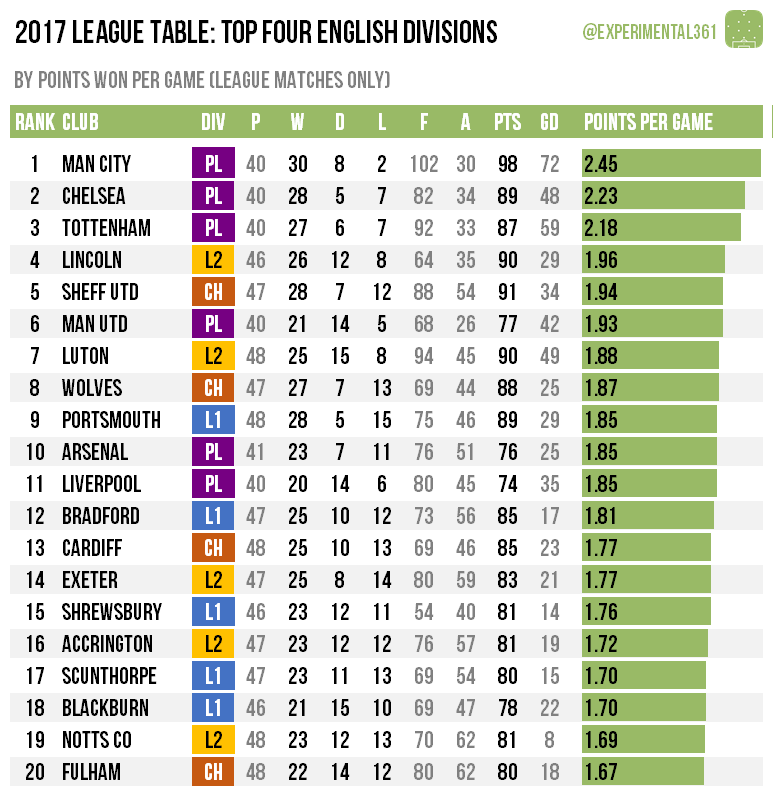
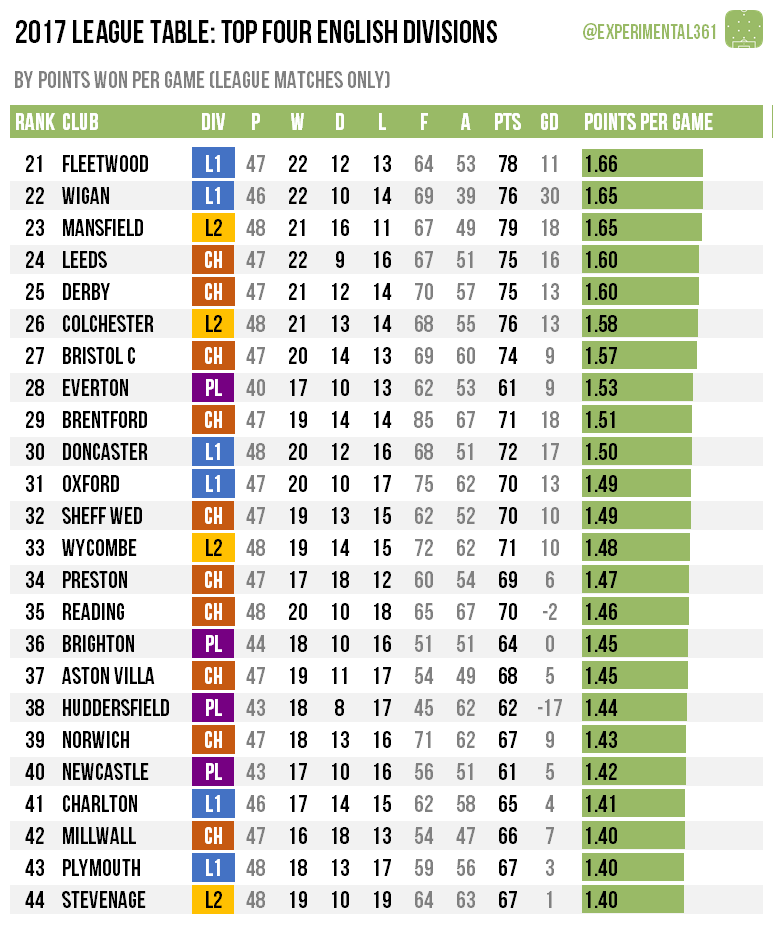
This is pretty simple really – all I’ve done is to calculate one massive league table sorted in descending order of points, then goal difference and then goals scored, except I’ve calculated them all on a per match basis for fairness. I’ve included some colour-coding for each club’s current division and for clubs who were promoted or relegated I’ve rolled their record from both divisions together.
Unsurprisingly Man City are top with 30 wins out of 40 and just two defeats in 2017, with Chelsea and Tottenham second and third. The back half of Lincoln‘s promotion season in the National League, plus their strong start to life back in League 2, is enough to make them the strongest performers outside the top flight. Sheffield United are just behind them after carrying similar momentum from League 1 to the Championship – both have a better record than Man Utd in 2017. Bottom of the pile are Sunderland with just six wins all year – they’re one of nine clubs with fewer than a point earned per game in 2017.

Individual sections
In case anyone wants to share this but it’s too tall, I’ve also broken it up into four sections – the top 20 and then three further ‘divisions’ of 24, to mirror the actual league structure:


You must be logged in to post a comment.