E Ratings update: League 1, 3 Jan 2016
You may remember that at the end of last season I introduced a new method for measuring and tracking clubs’ attacking and defensive strength, called E Ratings.
You can click that link for both a short and a long explanation of these, but put simply they assess clubs based on the quality of chances they create and allow (rather than the goals they score and concede). The idea is to try and measure clubs’ underlying performances, rather than just their results, to get a better idea of whose performances are sustainable and who may be in a false position.
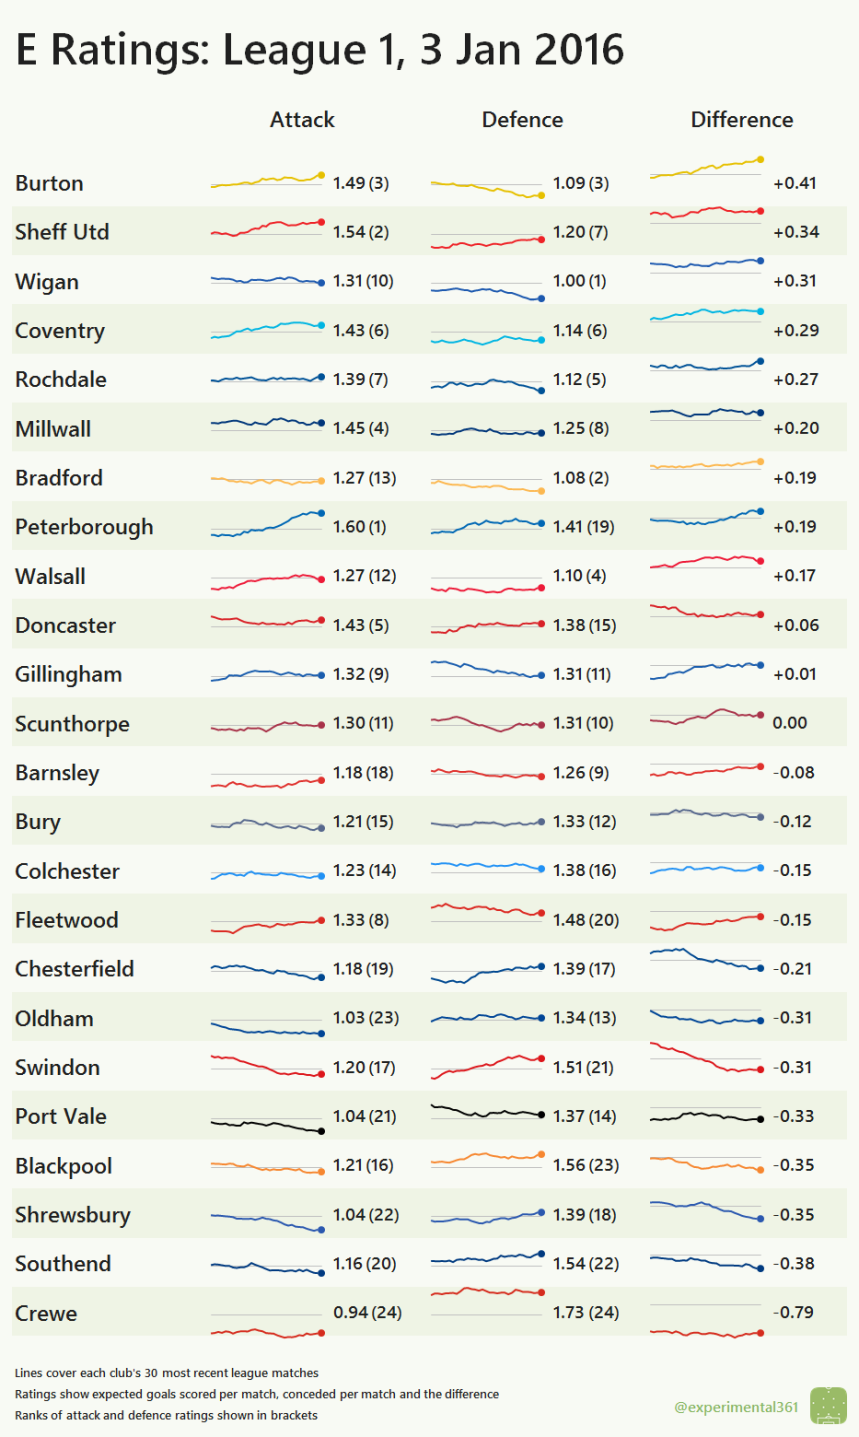
The graphic below shows how each club’s attack, defence and combined rating has changed over the past 30 league matches, with the clubs listed in descending order of their combined rating. It works as follows:
- The first column of “sparklines” shows how each team’s attack rating – i.e. how many goals they’d be expected to score against an average opponent – has changed over the past 30 league matches. The grey horizontal line is the long-term average of around 1.3 goals, so stronger attacks will be above it and weaker ones below it. The number shows the current rating and the bracket after it shows their rank within the division.
- The second column shows the defence rating – i.e. how many goals each club would be expected to conceded in an average match – which has the same long-term average (obviously), but now lower is better.
- The third column tracks the difference between the two: literally subtracting the defensive rating from the attacking one to get a net “expected goal difference per game”. The average line here is set at zero.
- Promoted and relegated clubs have had an “exchange rate” applied to their data from last season.
At the top it looks as though Burton‘s incredible season is no accident: their underlying performances have increased in step with their actual ones.
Interestingly the model ranks Sheffield United as the next best performers in the division, despite them being some way off the promotion pace and struggling for consistency. The Blades’ attack is particularly strong, although their defence appears to be on the wane.
Both Gillingham and Walsall have made big strides forward this season but have plateaued of late.
The Martin Ling effect is clearly visible at Swindon, who look to have been in free fall until he steadied the ship. The Robins have fallen a long way since last season, when their E Rating was pretty healthy.
At the bottom, the model appears to have had it in for Crewe for some time, ranking them comfortably the weakest side in the division. It also doesn’t care much for Southend and suggests that their underlying performances are deteriorating.
Predicting the rest of the season
While these ratings are useful in their own right, I wanted to see if I could do something interesting with them. Below I’ve used each club’s current ratings and those of their remaining opponents to predict how the rest of the season could play out. Each match has been simulated thousands of times using the current E Ratings to generate probabilities for where each club will finish.
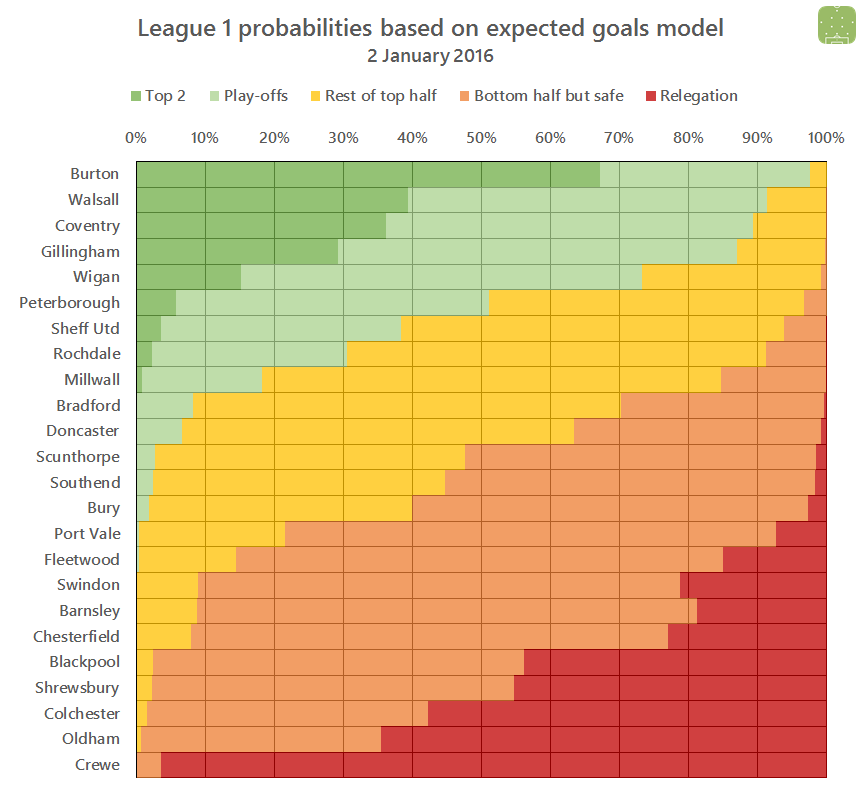
This graphic shows the cumulative probability of where each club could finish, in descending order. You can think of the ordering of the teams down the left hand side as a “best guess” of the final league table, with the coloured bars showing the relative likelihood of each club ending up in a certain section of the table:
Using the top row as an example, the model suggests that Burton have a roughly two-in-three chance of claiming one of the automatic promotion spots.
On average, Walsall, Coventry and Gillingham have around a one-in-three chance of securing elevation to the Championship as things stand. The Saddlers’ chances were a lot higher before their dire performance against Rochdale at the weekend.
The model also suggests that things look very bleak for Crewe, whose chances of evading one of the four relegation slots currently stands at around 4%. However there is a lot of football still to be played and a few wins would make a big difference here.
My aim is to track this from now until the end of the season for the Football League and National League, and perhaps look at the promotion and relegation battles in a bit more depth. I’m not expecting these probabilities to remain set in stone, as there are plenty of matches still to play and the transfer window will also surely have a part to play.


You must be logged in to post a comment.