
Scatter graphics: League 2, 2 Sep 2017
As every League 2 club now has five matches under their belt, it’s borderline-justifiable to chuck their data into the scatter graphics to see how things are shaping up. Each of the four graphics is explained briefly below and at length here.
Shot dominance
First of all, here is how the number of shots taken by each club compares with those they face in return. The average number of shots taken per match is on the horizontal and the average number faced is on the vertical, so bottom right (take plenty, allow few in return) is good while top left (take few, allow plenty) is bad. The stripes are like contours: the greener the stripe, the better the performance (and vice versa for red).

Newport have flown out of the traps this season, having taken around five more shots per match than the average team and almost three more than anyone else. Crawley are another side not expected to do that well but giving a good account of themselves going forward so far.
Coventry‘s defence has been the most miserly but they’ve struggled to create much in return, while Morecambe, Grimsby and Forest Green have found life difficult at both ends of the pitch.
Attacking effectiveness
Now let’s look at attacking alone. The horizontal axis stays the same as in the graphic above, but now the vertical shows the average number of shots needed to score each league goal. Therefore bottom right is good (taking lots of shots and needing fewer efforts to convert) and top left is bad:
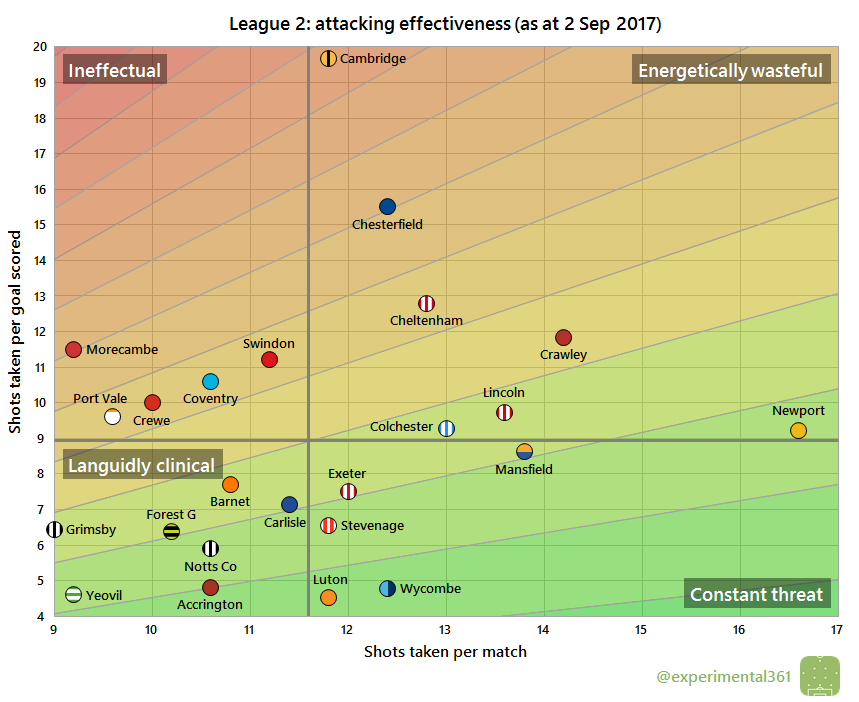
Cambridge are having a frustrating start to the season in front of goal: despite creating a respectable number of chances they’re struggling to convert them. Wasteful finishing seems to be the almost exclusive preserve of clubs beginning with ‘c’ as Chesterfield, Cheltenham and Crawley are all having issues with profligacy to some extent.
Yeovil have recorded some entertaining scorelines so far despite taking fewer shots than everyone except Morecambe and Grimsby. The Glovers have needed around half as many attempts as the average team to find the net so far: more efficient than anyone except Luton.
Defensive effectiveness
Next let’s look at the defensive situation – basically take the above chart and replace the word “taken” for “faced” on both axes. Now top left is good – facing fewer shots and able to soak up more per goal conceded – and bottom right is bad:
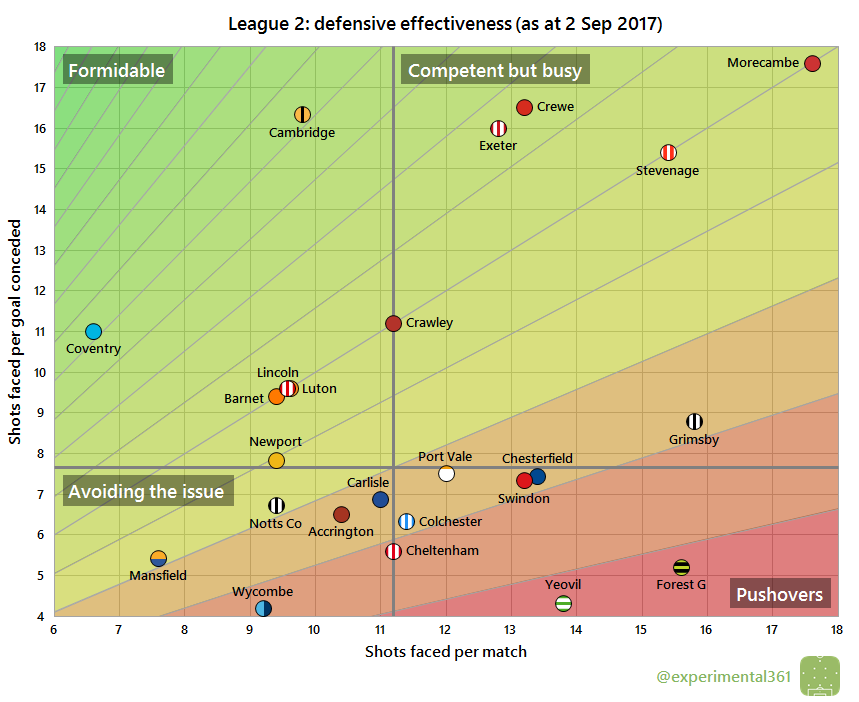
Five defences have soaked up an impressive number of shots for each goal conceded so far, with Morecambe once again combining this level of resilience with a huge number of chances allowed. It’s some consolation for Cambridge that their opponents are finding it as difficult to score as their own strikers.
The teams who play in green – Yeovil and Forest Green – are looking worryingly porous at the back, while Wycombe‘s efforts to restrict their opponents’ opportunities are being undermined by conceding a goal for every 4.2 shots faced so far.
Expected goals
Finally here’s an attempt at correcting the first graphic for the quality of chances created and allowed, using the same “expected goals” values that power my shot timelines (explained here). The reason for doing this is that the results tend to correlate more strongly with performance than when we treat all shots equally:

Newport‘s attack looks even more impressive when we correct for chance quality – I don’t expect such a huge output to last over a season but they can afford to cool off quite a bit without it denting any potential promotion charge.
Lincoln have adapted far better to this level than Forest Green so far: the Imps are keeping pace with an expensively-assembled Mansfield side while Rovers have been struggling and look off the pace at both ends of the pitch. However it’s still early days and plenty can change.
Exeter and Cheltenham have provided plenty of entertainment overall while Coventry matches have been relatively low on action so far.

You must be logged in to post a comment.