
Scatter graphics: Championship, 27 Sep 2017
As most EFL clubs have now now played 10 matches, it’s worth a proper update to the scatter graphics to see how things are shaping up. Each of the four graphics is explained briefly below and at length here.
Shot dominance
First of all, here is how the number of shots taken by each club compares with those they face in return. The average number of shots taken per match is on the horizontal and the average number faced is on the vertical, so bottom right (take plenty, allow few in return) is good while top left (take few, allow plenty) is bad. The stripes are like contours: the greener the stripe, the better the performance (and vice versa for red).

Brentford may be sitting low down in the table at the moment but they’ve been the most dominant team in the division so far, carving out over 18 shots per match and facing fewer than 10 in return, so I suspect that they’ll continue to climb the table.
Cardiff continue to look impressive overall, while Middlesbrough and Preston will probably need a slight shift of emphasis towards attack if they’re to push for promotion.
Burton look horribly out of their depth at the moment, having allowed around 10 shots more per match than they’ve taken, while Ipswich‘s presence in the top six is surprising given their similar imbalance.
Bristol City are the division’s entertainers at the moment, with their matches seeing an average of almost 30 shots.
Attacking effectiveness
Now let’s look at attacking alone. The horizontal axis stays the same as in the graphic above, but now the vertical shows the average number of shots needed to score each league goal. Therefore bottom right is good (taking lots of shots and needing fewer efforts to convert) and top left is bad:

There are three standout wasteful finishers in the division so far, with Bolton having had a predictably horrible start. The Trotters haven’t created much but still look to have been unlucky in front of goal and their fortunes should improve.
The more respectable number of shots taken by Birmingham also look as though they should have yielded more goals, while Brentford‘s “kitchen sink” approach has seen them fire in around twice as many attempts as Bolton but are still only outside the relegation zone on goal difference.
Ipswich‘s ruthless finishing – they’ve been almost five times as clinical as Bolton so far while only taking around a shot and a half more per match – has contributed to their strong start, but again I don’t expect such an extreme ratio of shots to goals to persist over the rest of their campaign.
Defensive effectiveness
Next let’s look at the defensive situation – basically take the above chart and replace the word “taken” for “faced” on both axes. Now top left is good – facing fewer shots and able to soak up more per goal conceded – and bottom right is bad:

Preston are soaking up an impressive – and again probably unsustainable – amount of shots for each goal conceded, but as they have allowed fewer chances then anyone else their defence is likely to remain one of the division’s strongest performers.
Bristol City‘s strong start owes something to both a clinical attack (see the previous chart) and a resilient defence, which has seen the balance of all those shots in their matches tip in their favour.
Struggling Bolton haven’t actually allowed that many attempts at their goal, but along with Hull have been conceding frustratingly regularly.
Expected goals
Finally here’s an attempt at correcting the first graphic for the quality of chances created and allowed, using the same “expected goals” values that power my shot timelines (explained here). The reason for doing this is that the results tend to correlate more strongly with performance than when we treat all shots equally:
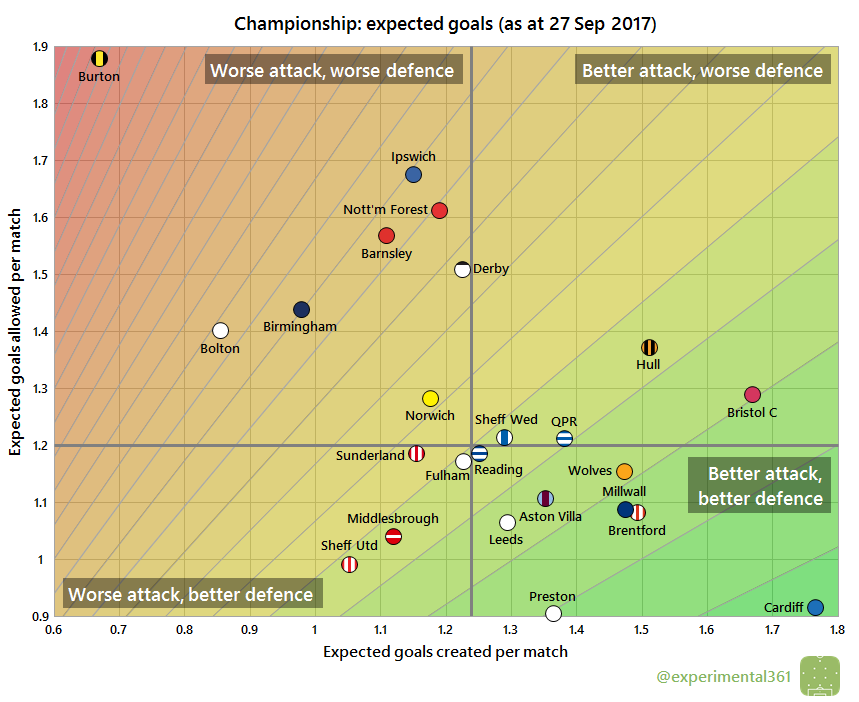
Cardiff‘s strong start to the season is no fluke: they’ve been the division’s best performers overall. Alex Neil also looks to be doing a great job of restoring his reputation at Preston, although their defence looks stronger than their attack, and Millwall deserve a mention for their impressive return to the second tier.
Burton look to be in the most trouble so far: they look worryingly off the pace at both ends of the pitch and are doing well to stay out of the bottom three.
Sheffield United have moved into the automatic promotion places but their attack looks far less impressive than their defence, so without some rebalancing they may struggle to sustain a promotion challenge.

You must be logged in to post a comment.