
2018 league table
Now that the final league game of 2018 has been played, it seemed only fitting to continue the tradition of cranking out a calendar year table for the 92 Premier League and EFL clubs.
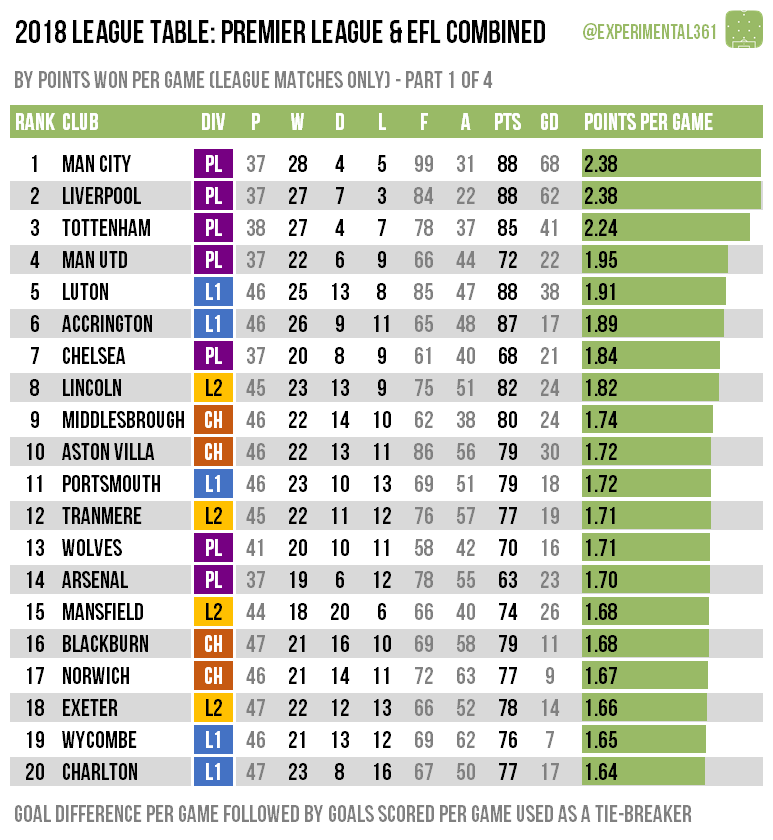
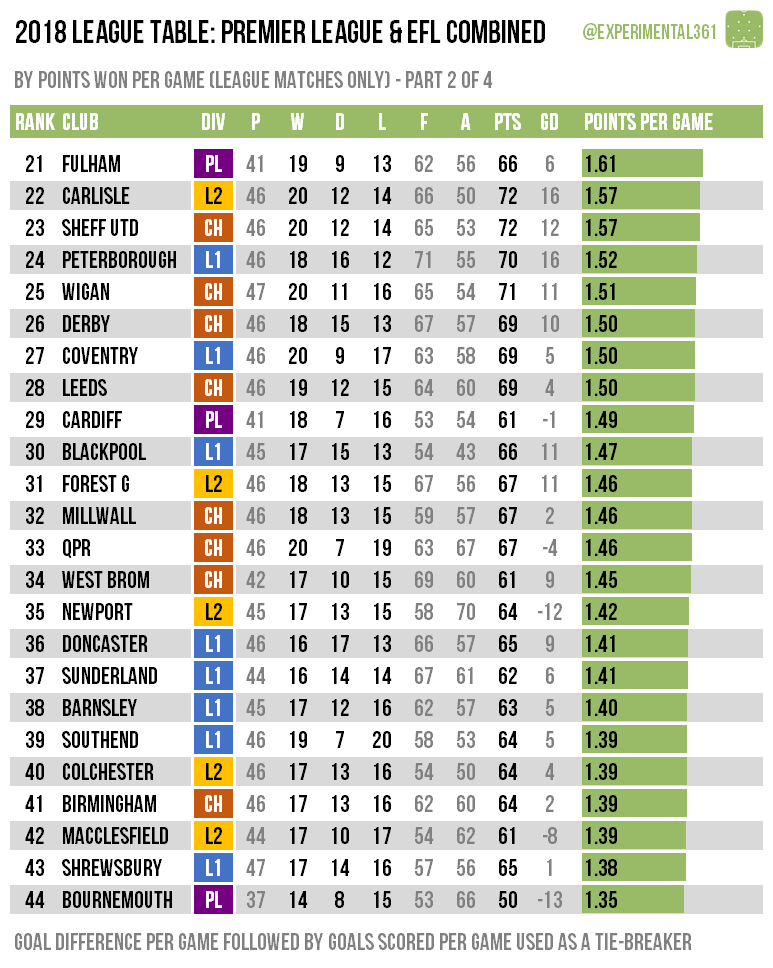
This is pretty simple really – all I’ve done is to calculate one massive league table sorted in descending order of points, then goal difference and then goals scored, except I’ve calculated them all on a per match basis for fairness. I’ve included some colour-coding for each club’s current division and for clubs who were promoted or relegated I’ve rolled their record from both divisions together.

Man City are unsurprisingly top given their romp to last season’s title, but their poor form of late – combined with Liverpool‘s excellent unbeaten start to 2018/19 – means that Pep Guardiola’s side are only top of 2018 on goal difference. Tottenham are the only other team to have taken more than two points per game this year and also have a goal difference of better than +1 per match.
Despite the chaotic end to Jose Mourinho’s spell at Old Trafford, Man Utd still rank fourth overall, edging out Luton and Accrington who both looked comfortable in stepping up from League 2 to League 1. The solitary League 2 side in the top 10 are Lincoln, who have also seamlessly adjusted following a recent promotion.
At the bottom of the 2018 table are Huddersfield who have managed just five wins and eight draws from 37 matches this year and scored at a rate lower than two goals every three games. Two other Premier League clubs – Southampton and Burnley – are among the teams to have earned less than a point per match this year. Three of the six worst performing teams are from the lower reaches of the Championship: Reading, Ipswich and Bolton.
EDIT Here are a few other things that I subsequently realised or were pointed out to me on Twitter:
- Liverpool‘s defence was the best by far in 2018 [credit], conceding under 0.6 goals per game. There were only five other sides who shipped under a goal per match and the next best rate was Middlesbrough‘s 0.83.
- The two worst-performing teams this year – Reading and Huddersfield – contested the 2017 Championship play-off final, so 2018 was quite the gear change for them [credit].
- Mansfield have had a lot of stalemates this year: while roughly a quarter of football matches overall end in draws, almost half (45%) of theirs did. The good news is that only Liverpool and Man City lost a smaller percentage of their games.
Individual sections
In case anyone can’t read that single tall graphic on their phone, I’ve also broken it up into four sections – the top 20 and then three further ‘divisions’ of 24, to mirror the actual league structure:


If you’re interested, here are the 2017 and 2016 tables for reference.

You must be logged in to post a comment.