
Scatter graphics: League 1, 19 Mar 2019
I realised over the weekend that it’s been a fair while since I updated the scatter graphics. These compare the attacking and defensive performances of every team in a division. Each of the four graphics is explained briefly below and at length here.
Shot dominance
First of all, here is how the number of shots taken by each club compares with those they face in return. The average number of shots taken per match is on the horizontal and the average number faced is on the vertical, so bottom right (take plenty, allow few in return) is good while top left (take few, allow plenty) is bad. The stripes are like contours: the greener the stripe, the better the performance (and vice versa for red).
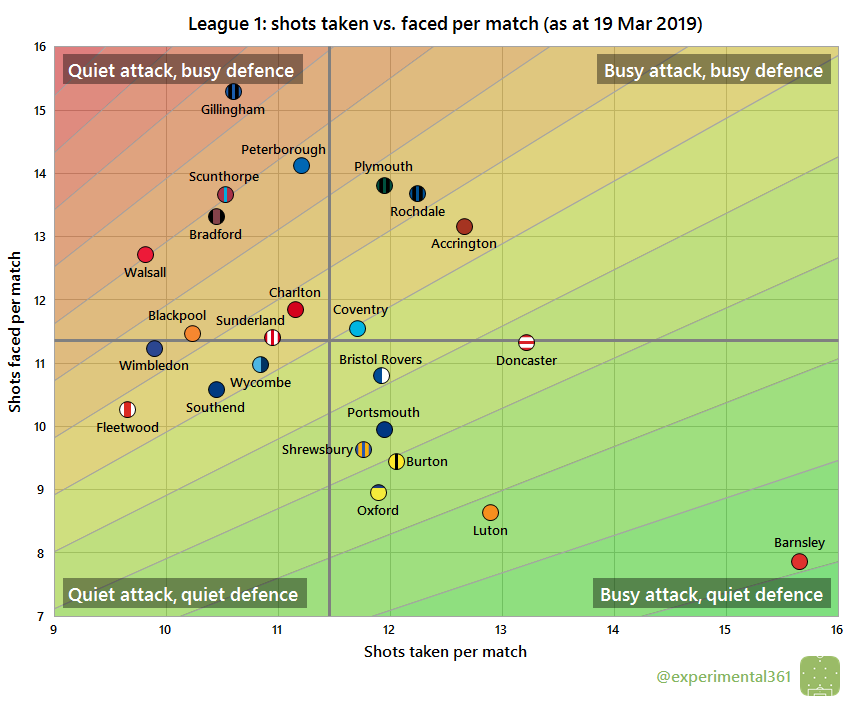
Barnsley remain the standout side in raw shot terms, firing in almost twice as many shots as their opponents this season. Leaders Luton have been dominant to a lesser extent and strangely a few of the division’s strugglers in Shrewsbury, Oxford and Bristol Rovers have also created more chances than they’ve faced. Peterborough‘s promotion challenge always looked a bit suspect to me given that they’ve occupied the undesirable top left quadrant for most of the season.
Attacking effectiveness
Now let’s look at attacking alone. The horizontal axis stays the same as in the graphic above, but now the vertical shows the average number of shots needed to score each league goal. Therefore bottom right is good (taking lots of shots and needing fewer efforts to convert) and top left is bad:
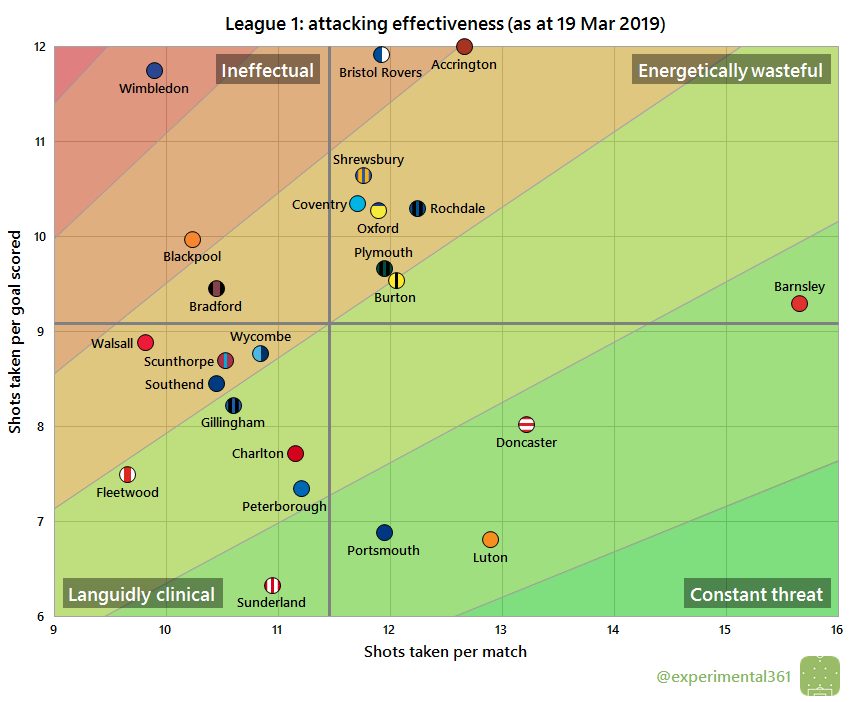
Sunderland have created relatively few chances this season but have been ruthless in front of goal. It’s been a dismal campaign in front of goal for Bristol Rovers and Accrington, who have struggled to find the net despite getting shots off pretty frequently, and Wimbledon who have struggled for both quantity and quality.
Defensive effectiveness
Next let’s look at the defensive situation – basically take the above chart and replace the word “taken” for “faced” on both axes. Now top left is good – facing fewer shots and able to soak up more per goal conceded – and bottom right is bad:

Not only do they have the sharpest attack, but Sunderland have operated the most resilient defence this season, while Charlton have also built a promotion challenge on top of a stubborn back line. Despite only the top two sides allowing fewer shots at their goal than Oxford, Karl Robinson’s side have found it incredibly difficult to keep opponents from scoring.
Expected goals
Finally here’s an attempt at correcting the first graphic for the quality of chances created and allowed, using the same “expected goals” values that power my shot timelines (explained here). The reason for doing this is that the results tend to correlate more strongly with performance than when we treat all shots equally:
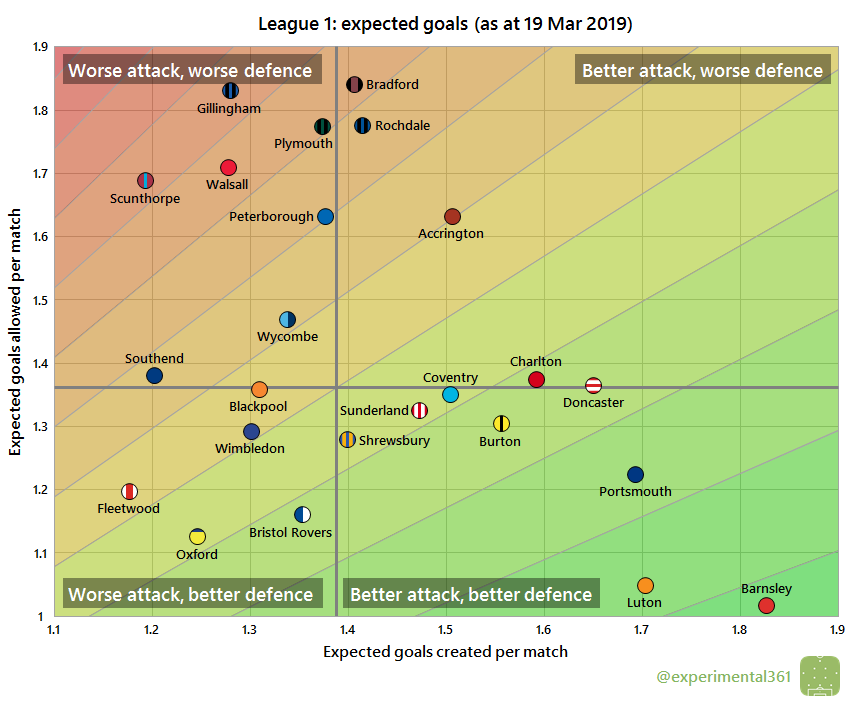
When we adjust for shot quality – as well as I can measure it – Barnsley, Luton and Portsmouth sit a lot closer together as the three leading sides in the division, with Sunderland sitting further towards the middle. Scunthorpe and Gillingham‘s performances are the most worrying overall, so if nothing changes then they may get dragged back towards the bottom four.

You must be logged in to post a comment.