
Championship trends, 21 Jan 2018
Now that we’re over halfway through the season, I thought that it was about time I updated the long-term trend graphics I introduced last year to see how each club fared throughout their last three seasons. These are explained in full here and briefly below.
Explanation
These are adapted from a very similar design by the excellent Swedish blogger Zorba138 intended to track a club’s long-term performance and whether this was an underachievement or an overachievement based on the balance of chances created.
There are two lines:
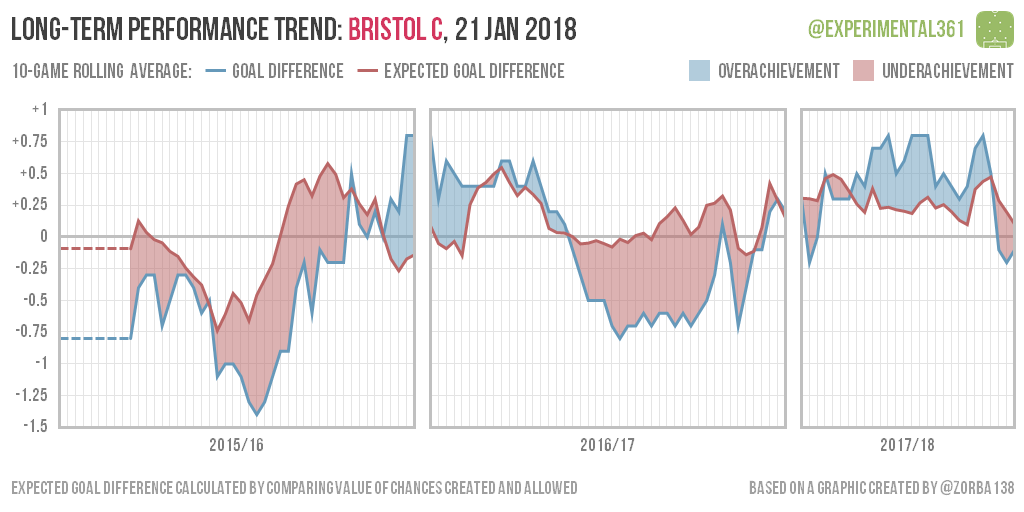
- The blue line shows the rolling average of a club’s goal difference over the last 10 league games;
- The red line shows the rolling average of their expected goal difference, based on the quality of chances they’ve created and faced.
Comparing these two allows us to see not only how a club’s performances have changed over time, but also whether there were any differences between the balance of chances created (a useful measure of underlying performance) and goals scored.
These are shaded as follows:
- Blue shaded areas are where goal difference is higher than chances created, suggesting an overachievement;
- Red shaded areas show the reverse, where the balance of chances was healthier than the actual goal difference, signalling underachievement.
Over the long term we’d expect the two lines to converge unless there’s a significant difference in a club’s attacking or defensive skill compared to the average for the division. We can’t tell from the data alone whether skill or luck is the cause, but the longer a difference persists the more I’d suspect the former.
Club-by-club graphics
Derby‘s promotion push looks to be the result of the Rams running slightly hot, although their underlying performances have looked pretty strong regardless in recent weeks. Fulham look set to mount a late promotion challenge of their own with an upsurge that could be about to mirror their impressive one from last season.
Barnsley‘s poor recent form doesn’t seem to be reflected in their performances, so there’s no obvious reason to panic at Oakwell. Fellow strugglers Reading haven’t been able to repeat their huge overachievement from last season, although their overall showing in the data actually looks to be an improvement on the tail end of last season.
It’s been a real rollercoaster at Leeds, who started brightly, dropped off a cliff and are now crawling their way back up it. However Preston can give them a run for their money, having abandoned the steady performances of last season for some ridiculously streaky form this time around.
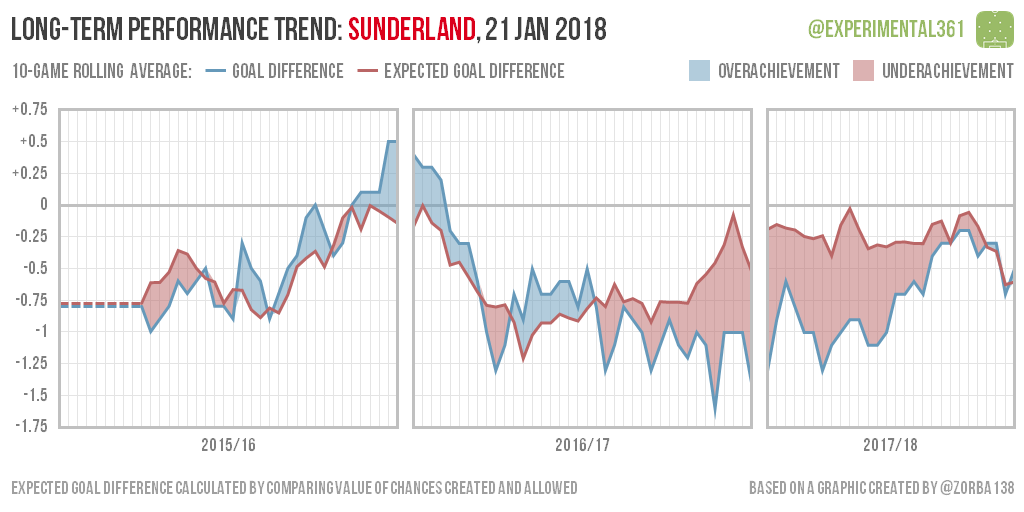
Mick McCarthy continues to defy the data at Ipswich, whose graph has been even bluer than usual this season. The opposite is true for QPR and Sunderland, who have spent most of their campaigns underachieving, although the Black Cats have been playing like a bottom half team regardless.


You must be logged in to post a comment.