
Premier League trends, 31 Dec 2018
Now that we’re roughly halfway through the season, I thought that it was about time I updated the long-term trend graphics to see how each club fared throughout their last two-and-a-bit seasons. These are explained in full here and briefly below.
Explanation
These are adapted from a very similar design by the excellent Swedish blogger Zorba138 intended to track a club’s long-term performance and whether this was an underachievement or an overachievement based on the balance of chances created.
There are two lines:
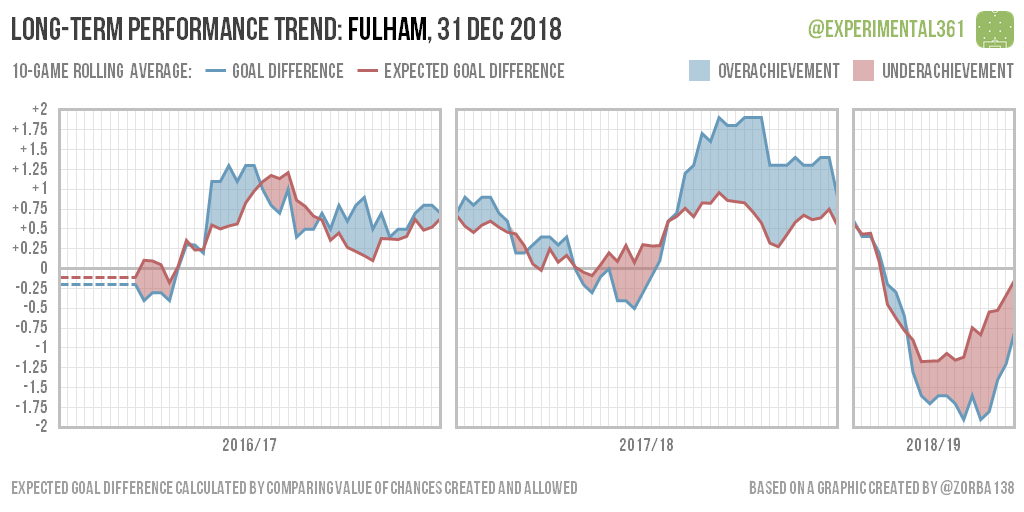
- The blue line shows the rolling average of a club’s goal difference over the last 10 league games;
- The red line shows the rolling average of their expected goal difference, based on the quality of chances they’ve created and faced.
Comparing these two allows us to see not only how a club’s performances have changed over time, but also whether there were any differences between the balance of chances created (a useful measure of underlying performance) and goals scored.
These are shaded as follows:
- Blue shaded areas are where goal difference is higher than chances created, suggesting an overachievement;
- Red shaded areas show the reverse, where the balance of chances was healthier than the actual goal difference, signalling underachievement.
Over the long term we’d expect the two lines to converge unless there’s a significant difference in a club’s attacking or defensive skill compared to the average for the division. We can’t tell from the data alone whether skill or luck is the cause, but the longer a difference persists the more I’d suspect the former.
Club-by-club graphics
Just to pick out a few that caught my eye, Arsenal look like a side whose bubble may be bursting, and their underlying performances don’t appear to be as good as at this stage last season. Liverpool and Man City are heading in opposite directions at the moment, with the Reds finding another gear just as the reigning champions are slipping. The amount of red on Southampton‘s graph shows how consistently they’ve underachieved in recent seasons, while Burnley are experiencing their first spell of underachievement in years.


You must be logged in to post a comment.