
2019 league table
Now that the final league game of 2019 has been played, it seemed only fitting to continue the tradition of cranking out a combined calendar year table for the Premier League and EFL clubs.
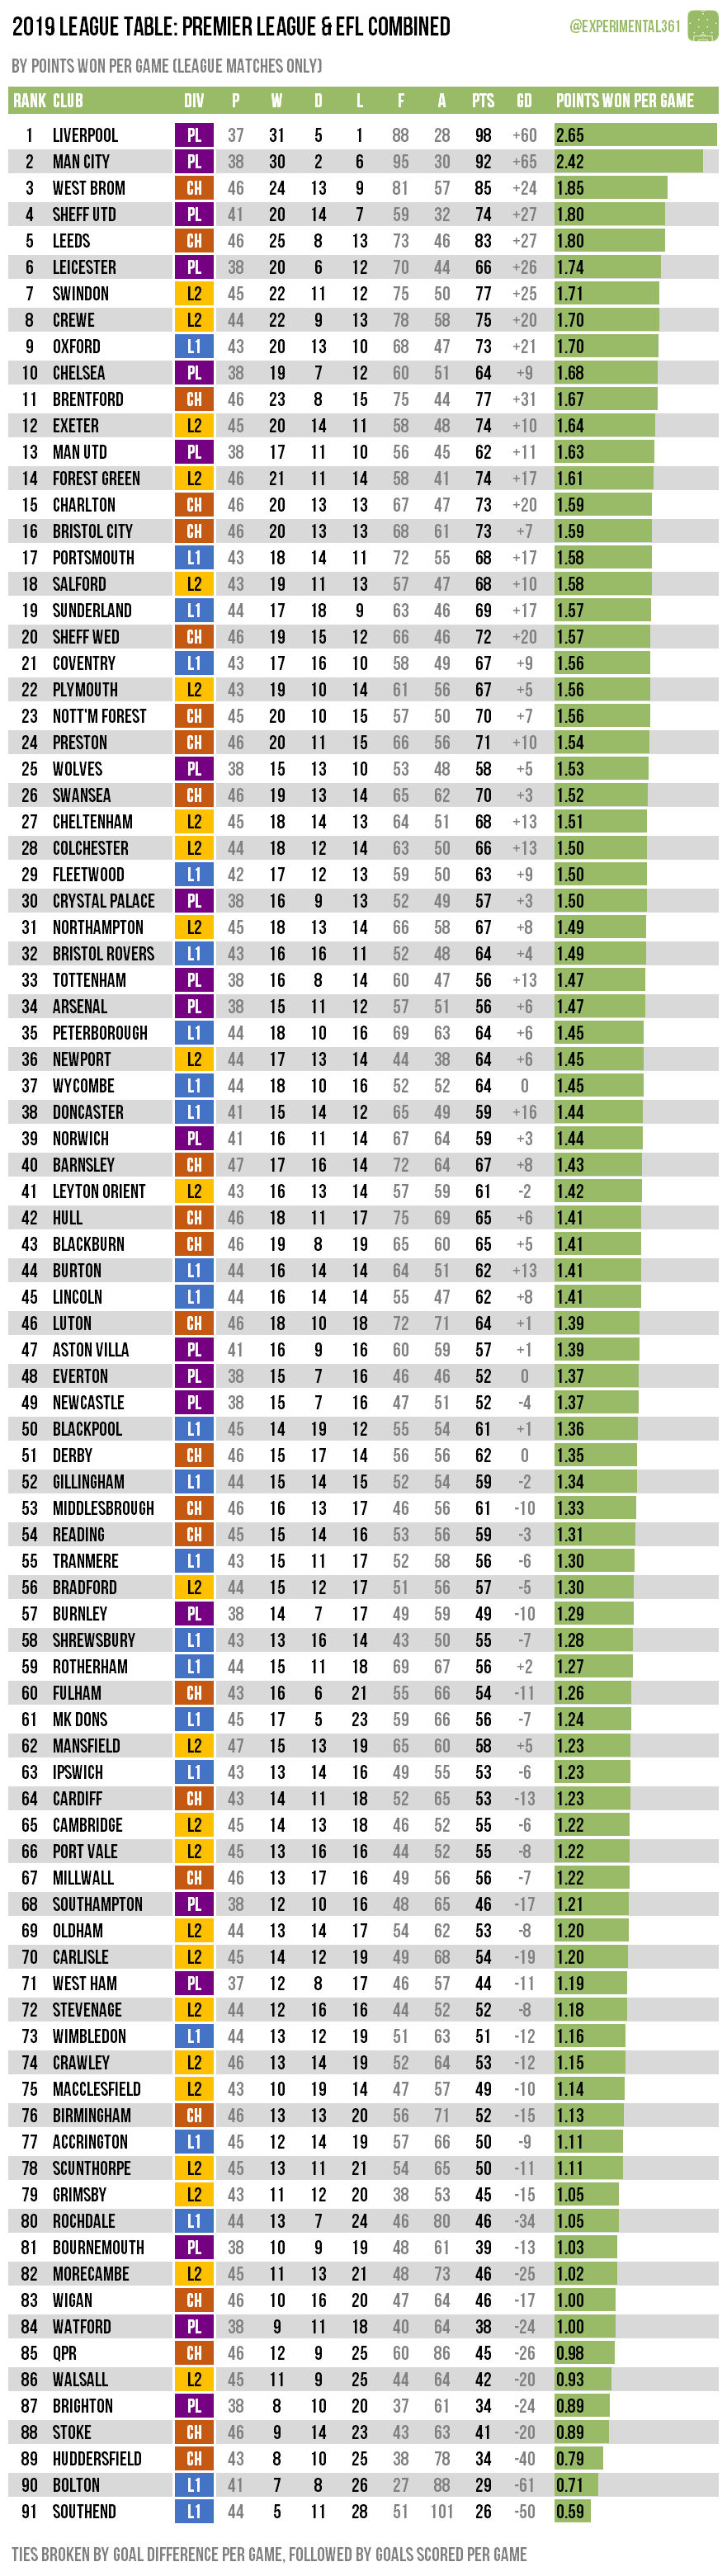
This is pretty simple really – all I’ve done is to calculate one massive league table sorted in descending order of points, then goal difference and then goals scored, except I’ve calculated them all on a per match basis – to adjust fairly for the different numbers of matches played.
I’ve only included league matches (no cups or play-offs) and I’ve included some colour-coding for each club’s current division. For clubs who were promoted or relegated I’ve rolled their record from both divisions together, including National League games for the two newly-promoted clubs in League 2. I’ve also included the 1-0 win that Brentford were awarded over Bolton at the end of last season even though it wasn’t actually played.
Observations
Liverpool are unsurprisingly top given their excellent year, with their first match of it being their only defeat (a 2-1 reverse at Man City). The Reds had the best defensive record with just 0.76 goals conceded per game, with Sheffield United‘s 0.78 narrowly better than Man City‘s 0.79. Three other clubs – Brentford, Forest Green and Newport – also managed to concede fewer than a goal per game.
Pep Guardiola’s side have boasted the best attack in 2019 though, with 2.50 goals scored per league game to Liverpool’s 2.38. Nobody else came close, with Leicester‘s 1.84 per game a distant third.
At the bottom it’s been an absolutely miserable year for Southend with just five wins from 44 league matches and 2.30 goals conceded per game – both the worst in the top four divisions. There have been worse attacks out there however, with Bolton‘s 0.66 goals per game the most dreadful of all and six other clubs netting fewer than a goal per game: Port Vale, Grimsby, Walsall, Brighton, Stoke and Huddersfield.
MK Dons deserve a mention for only drawing five games – only Man City saw a lower proportion of stalemates – while the 19 registered by Macclesfield was the highest share of any club this year. Luton and Aston Villa came the closest to a symmetrical record, with each winning as many games as they lost and scoring one goal more than they conceded.
The club with the biggest improvement since 2018, in both league position and points terms are Oxford, who are ranked 9th this year but were 70 places lower in 79th last year, having earned an average of 0.61 more points per game. Accrington have dropped the most places (71) since 2018 but Southend‘s performances have dipped marginally more in points terms (0.80 fewer points per game).
Individual sections
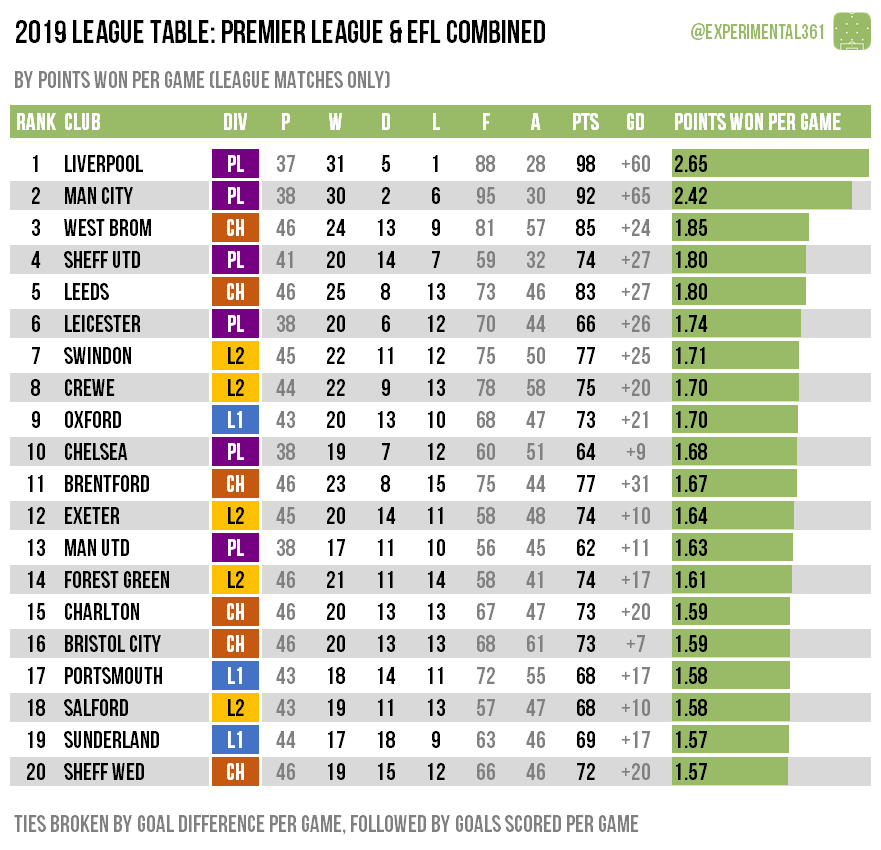
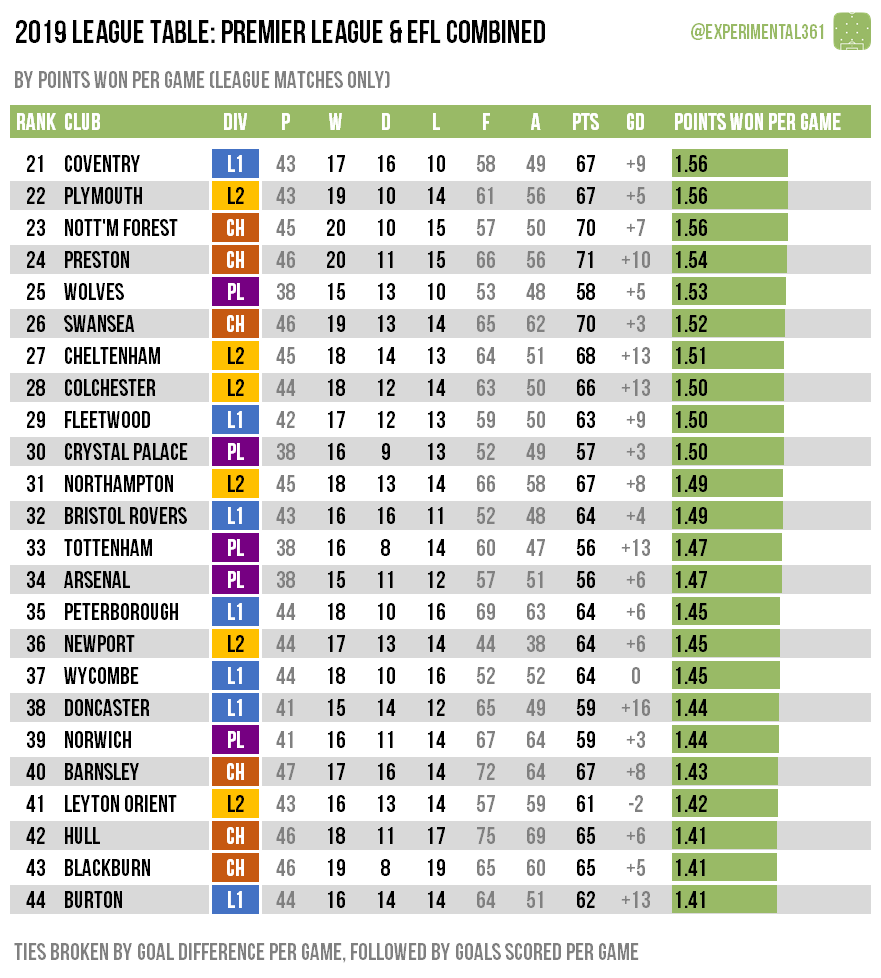
In case anyone can’t read that single tall graphic on their phone, I’ve also broken it up into four sections – the top 20 and then three further ‘divisions’ of 24 (the last one has to be 23 this year), to mirror the actual league structure:


Previous years
If you’re interested, here are the 2018, 2017 and 2016 tables for reference.

You must be logged in to post a comment.