
Euro 2020 permutations, 25 Jun 2021
Ahead of the Round of 16, I’ve updated the Euro 2020 permutations graphics to see how things have changed (and also to give the team-by-team graphics another outing by popular demand).
These are explained in full here.
Team graphics
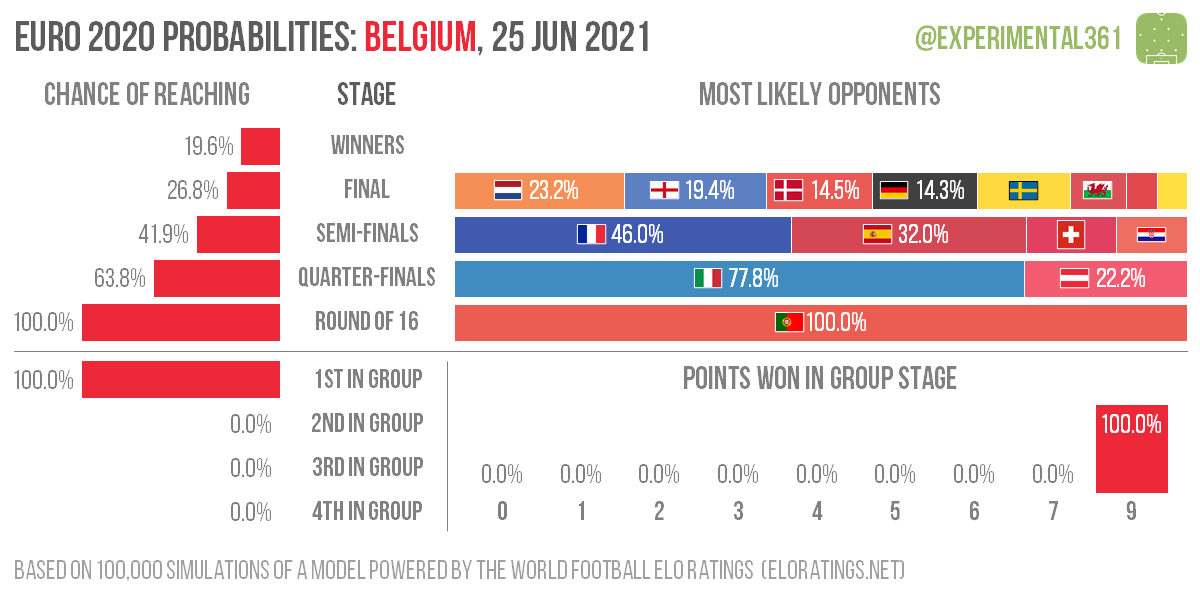
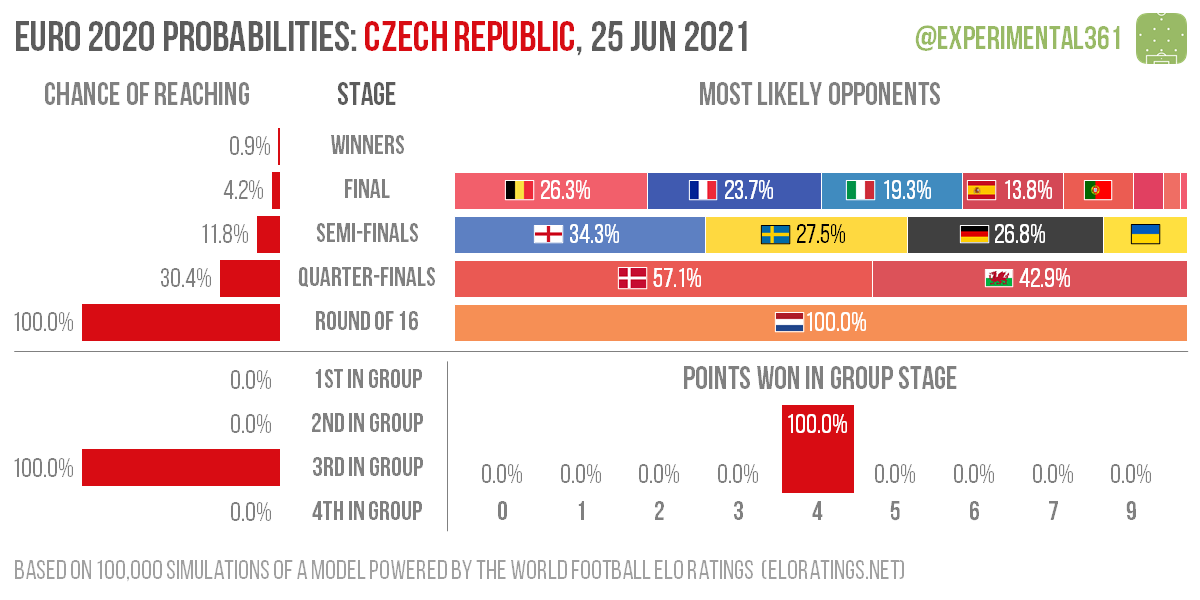
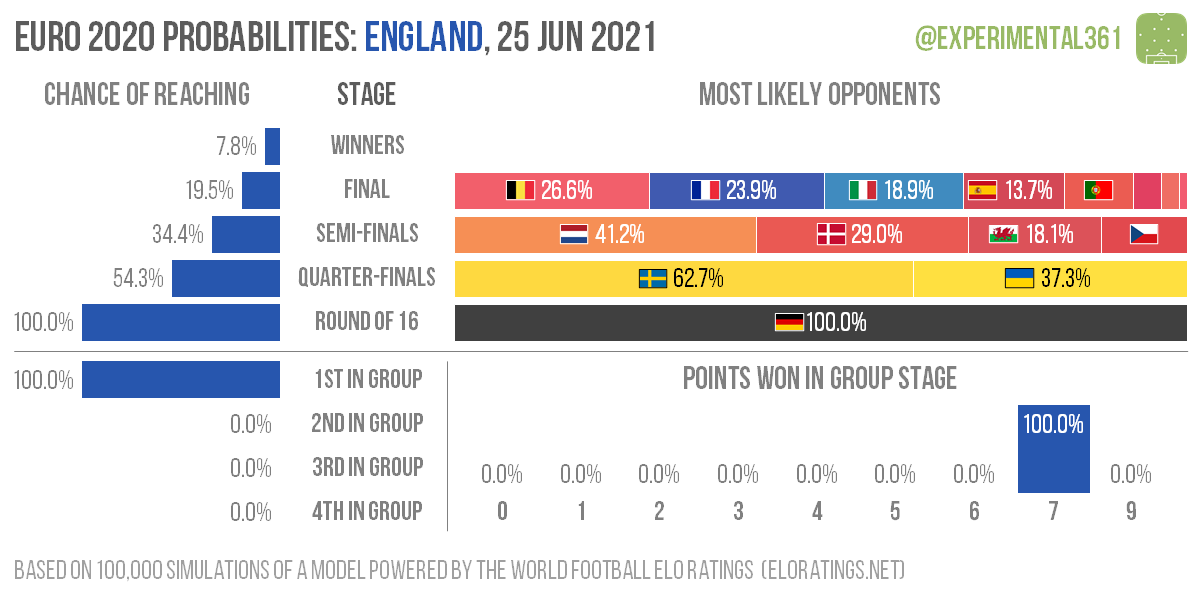
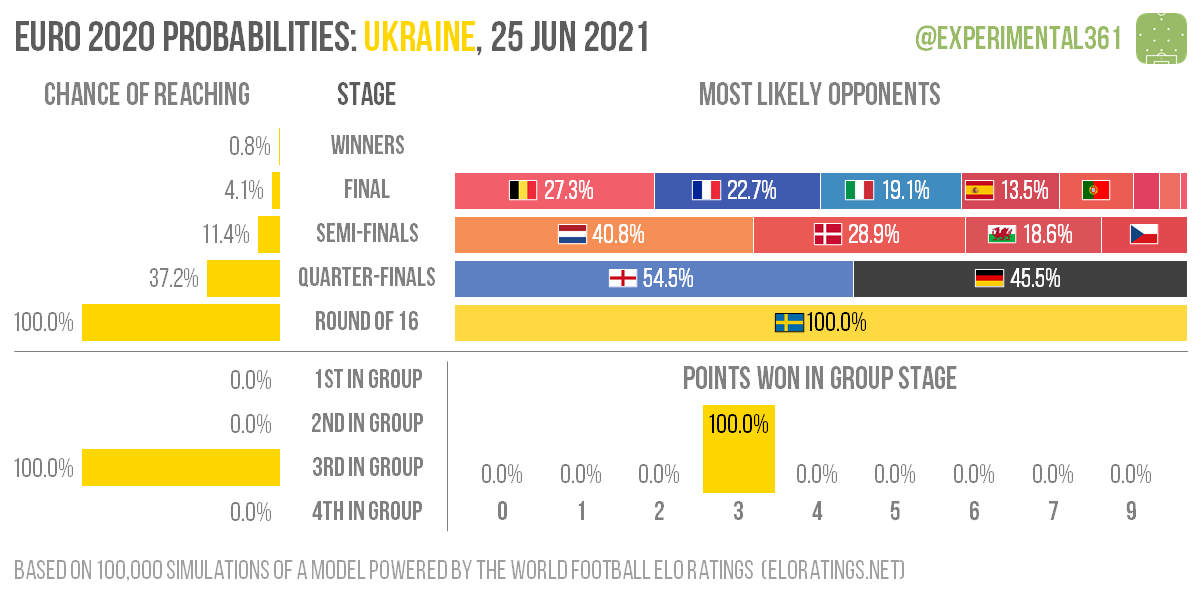
Here are the probabilities for each of non-eliminated teams alphabetical order. Starting in the bottom half, we have their chances of finishing in each position within their group on the left and their spread of possible points on the right (although this is now moot as the group games are all complete).
The top half is still relevant – it has their chances of reaching each stage of the tournament on the left and the spread of their most likely opponents at each stage in descending order on the right (with flags and percentages squeezed in where there’s enough space).


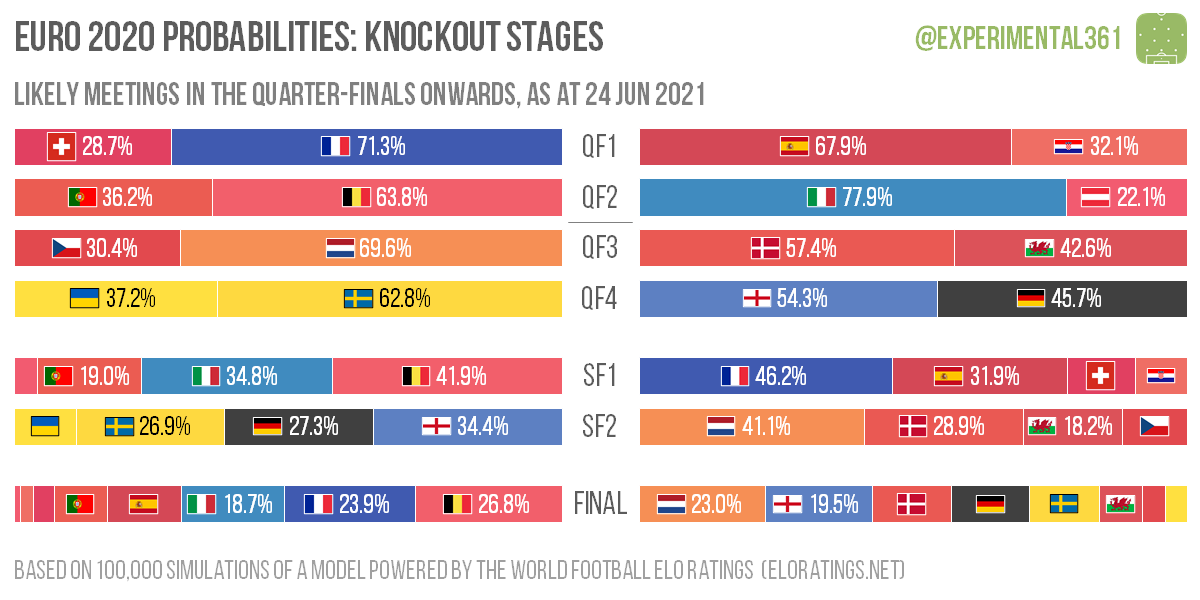
I’ve also got summary graphics for the quarter-finals onwards.

You must be logged in to post a comment.